Tag
BNB
42 articles tagged with “BNB”
Crypto
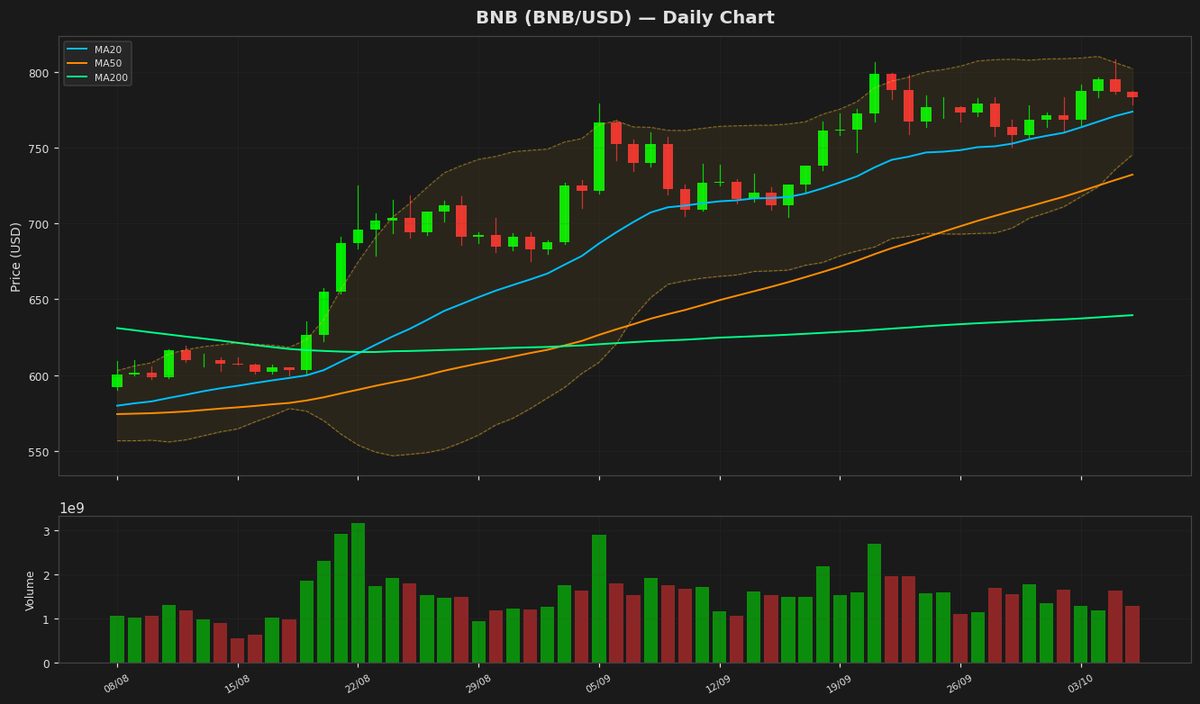
BNB prueba los $783 mientras el RSI se acerca al nivel clave de 50
Crypto
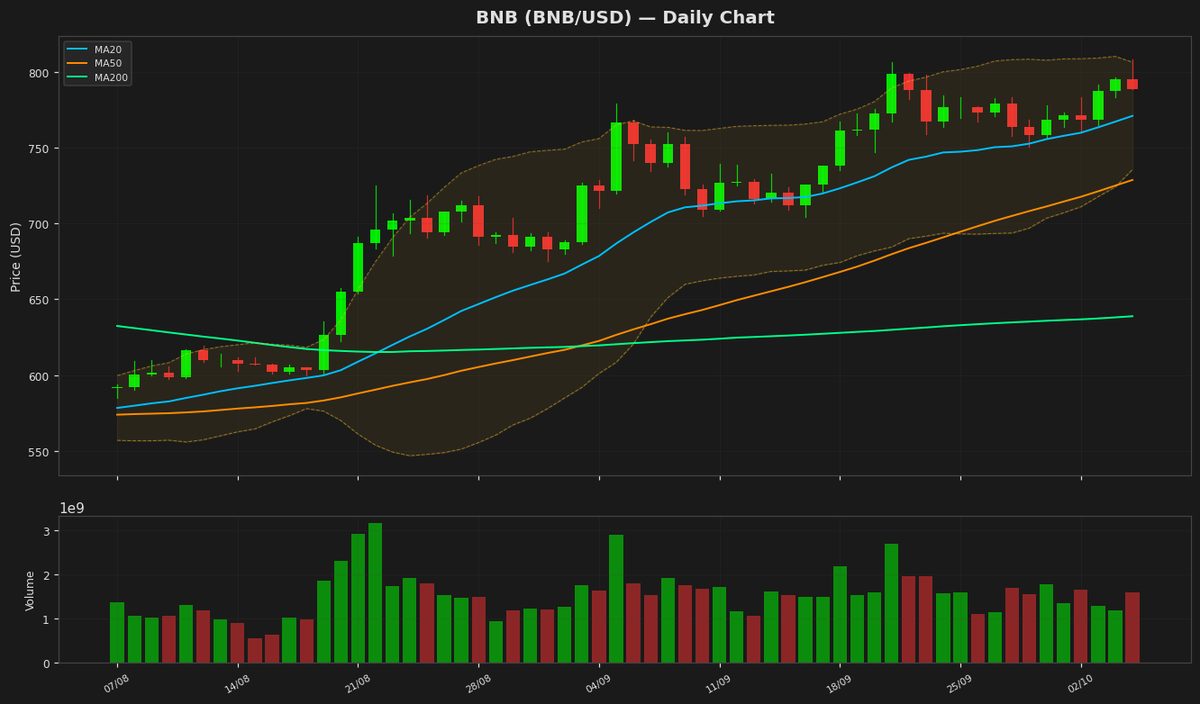
BNB prueba un soporte clave en $788 mientras el RSI se acerca a niveles de sobreventa.
Crypto
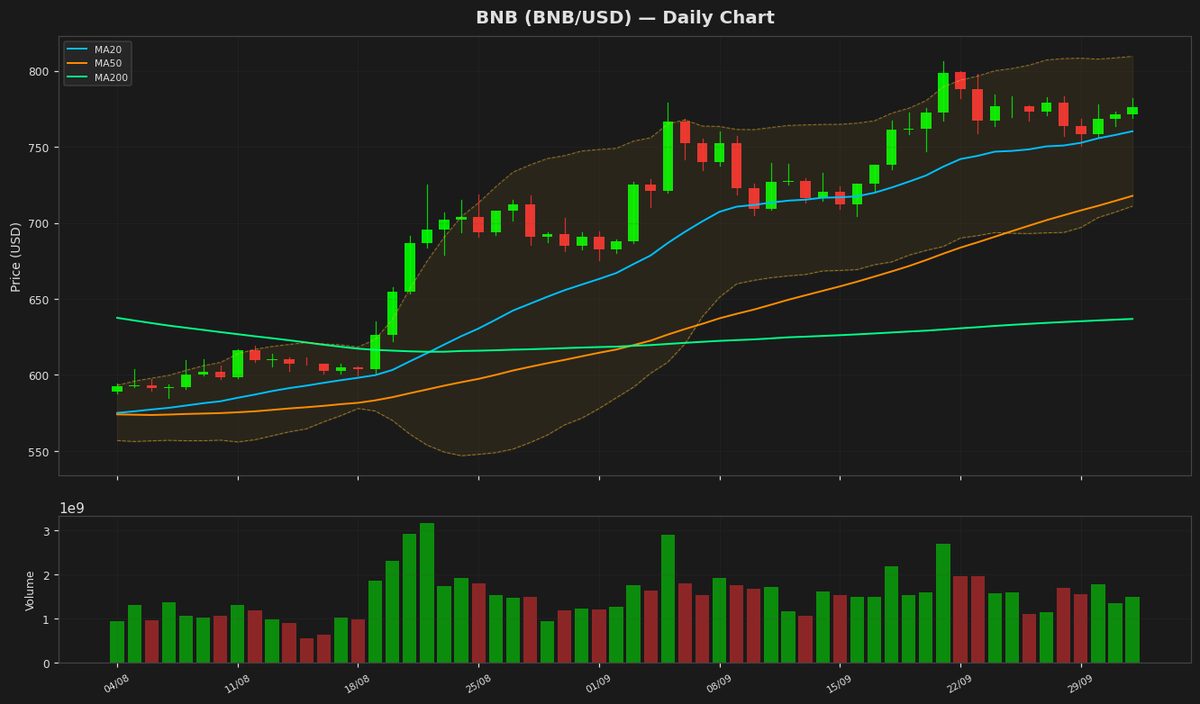
BNB apunta a $800 mientras el RSI se acerca a la zona alcista
Crypto
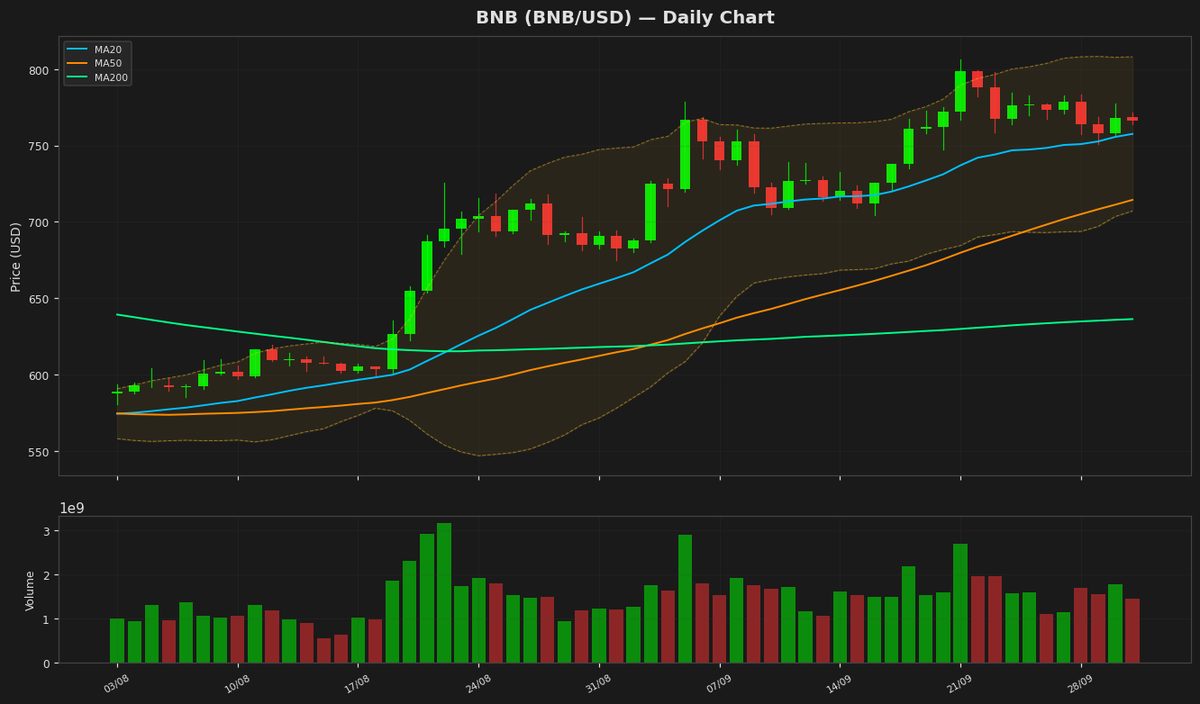
BNB se mantiene en $766 ante una leve caída, RSI neutral en 59.8
Crypto
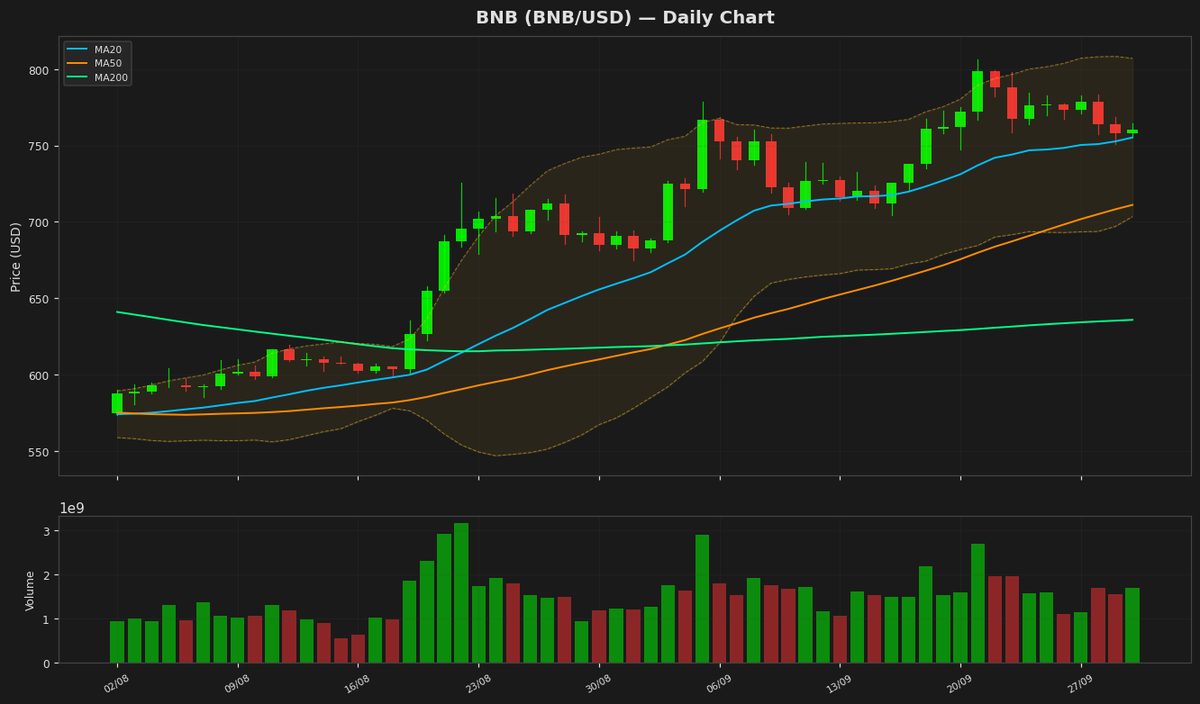
BNB apunta a $800 mientras el RSI se acerca a sobrecompra en $760.56.
Crypto
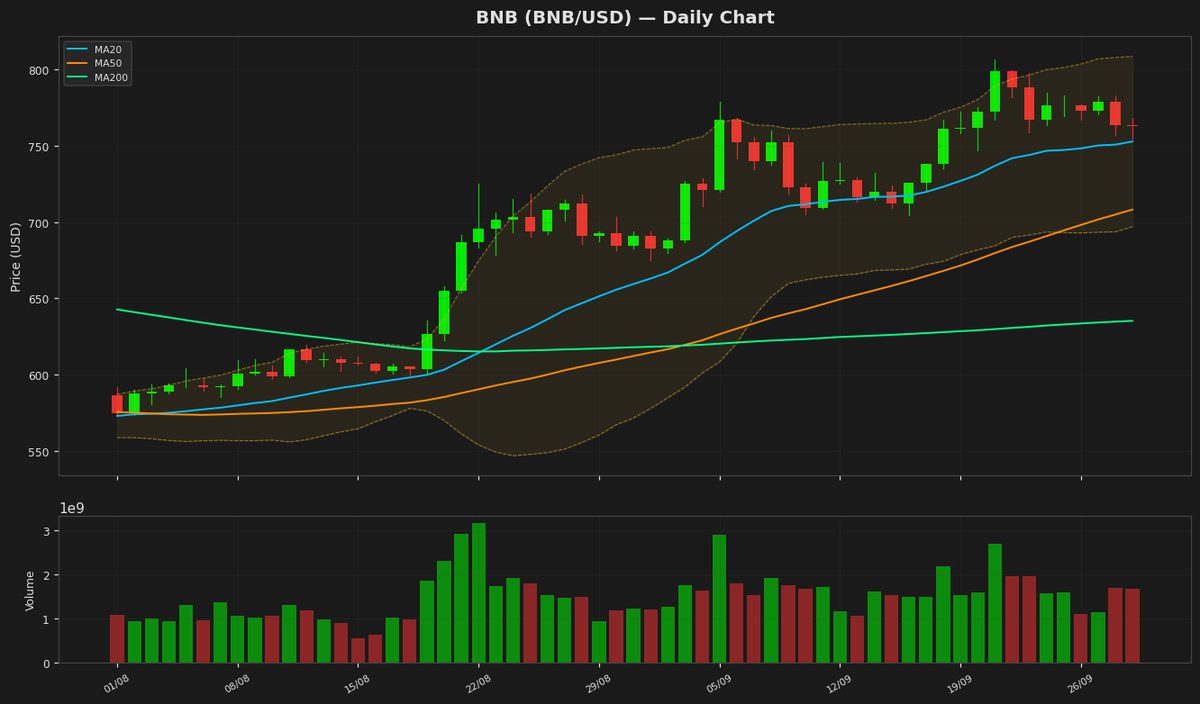
BNB se mantiene estable cerca de $763 mientras el RSI se acerca a niveles de sobrecompra
Crypto
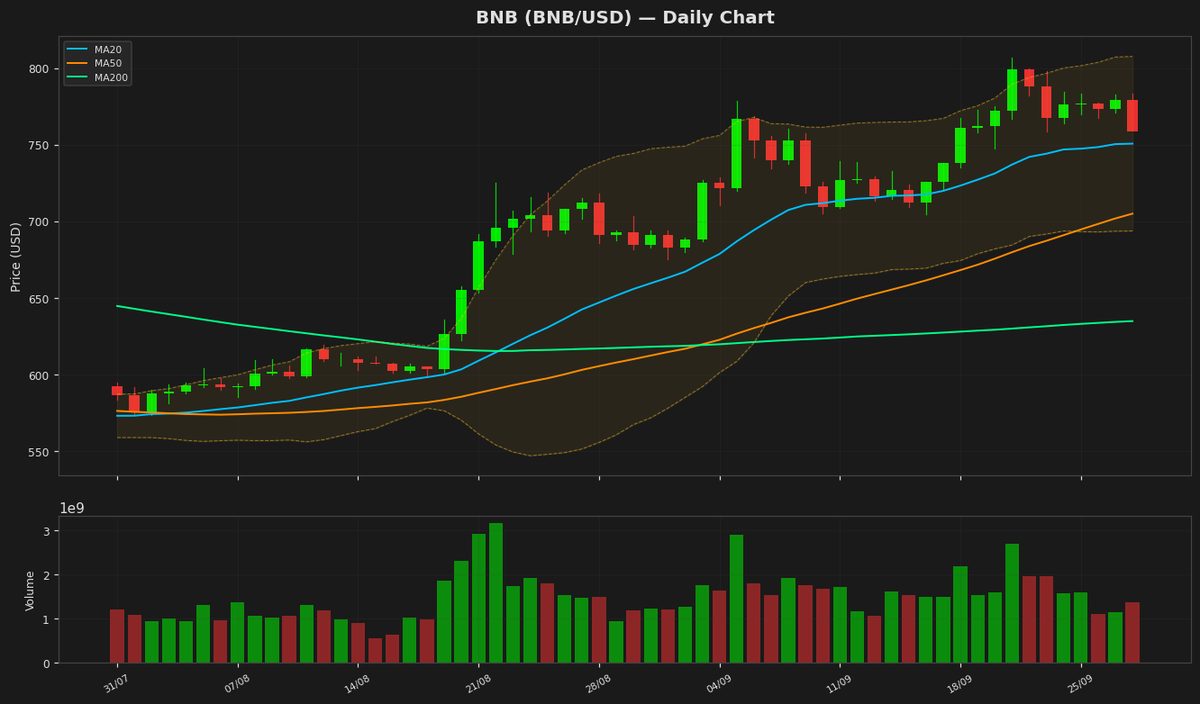
BNB cae a $758.70 mientras el RSI sugiere un posible rebote.
Crypto
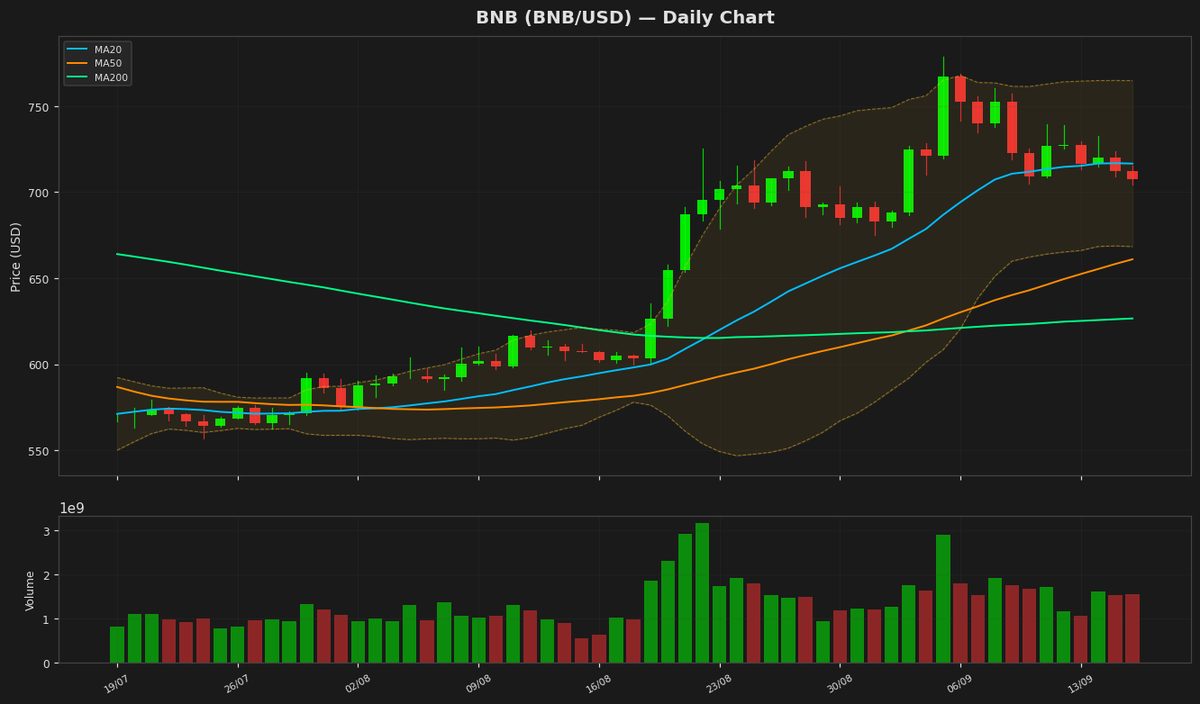
BNB cae a $707 mientras el RSI sugiere un posible rebote

Crypto
BNB apunta a $715 mientras el RSI se acerca a la zona alcista, sube un 0.59% hoy
Crypto
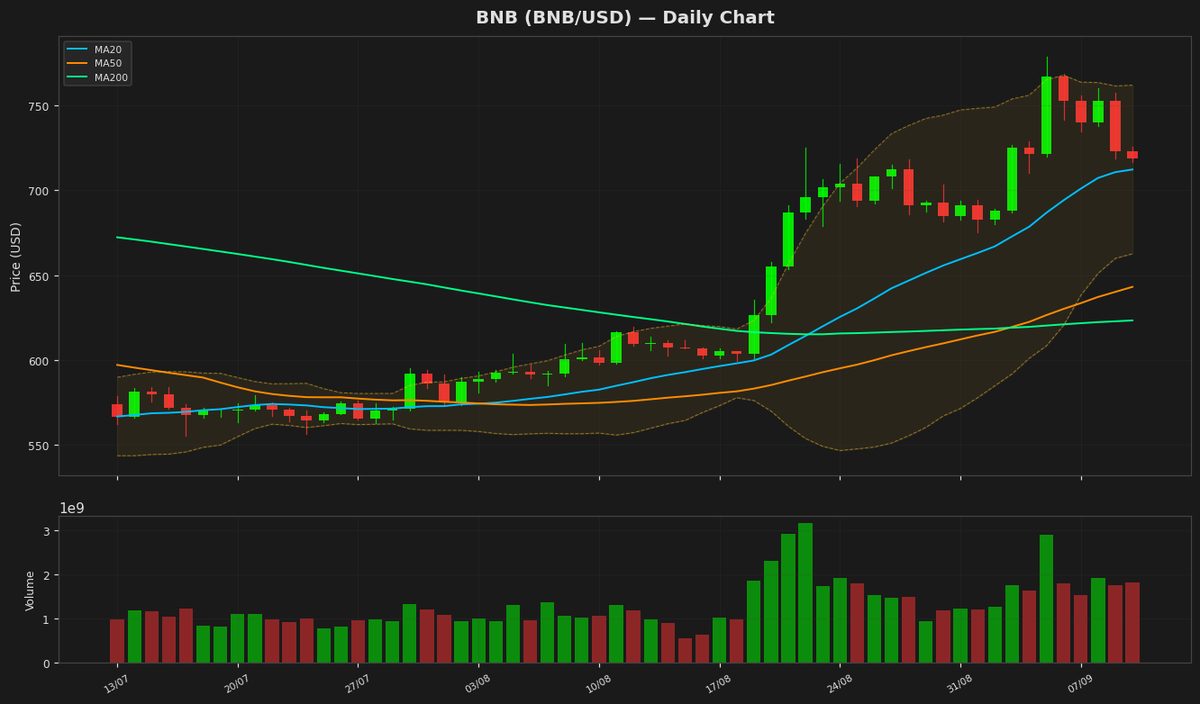
BNB se mantiene en $718 mientras el RSI se acerca al punto medio, los osos acechan
Crypto
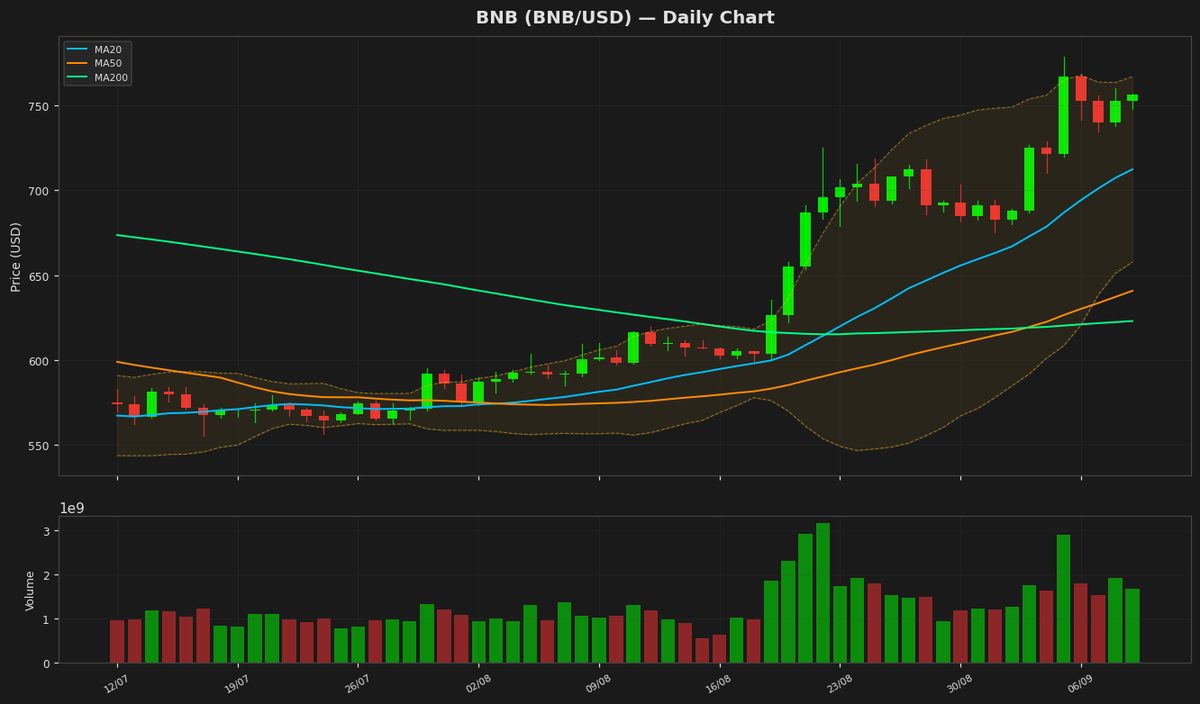
BNB se mantiene firme en $756 mientras que el RSI señala un impulso alcista
Crypto
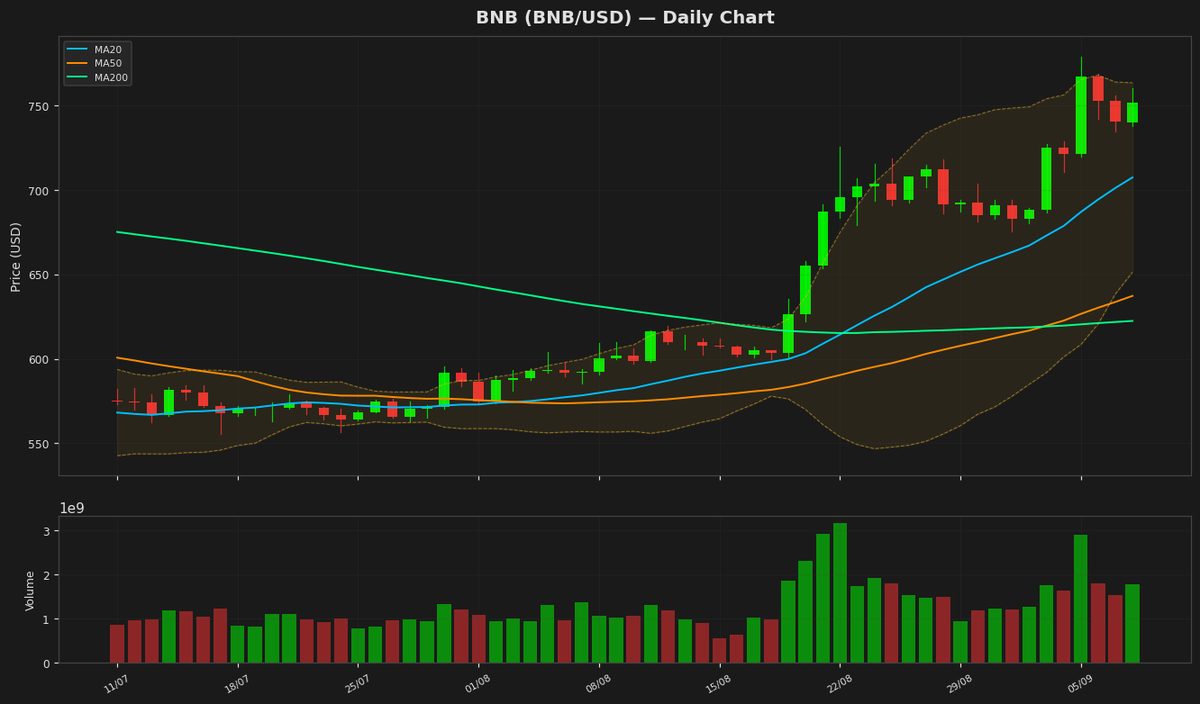
BNB apunta a $800 mientras el RSI se acerca a la zona de sobrecompra
Crypto
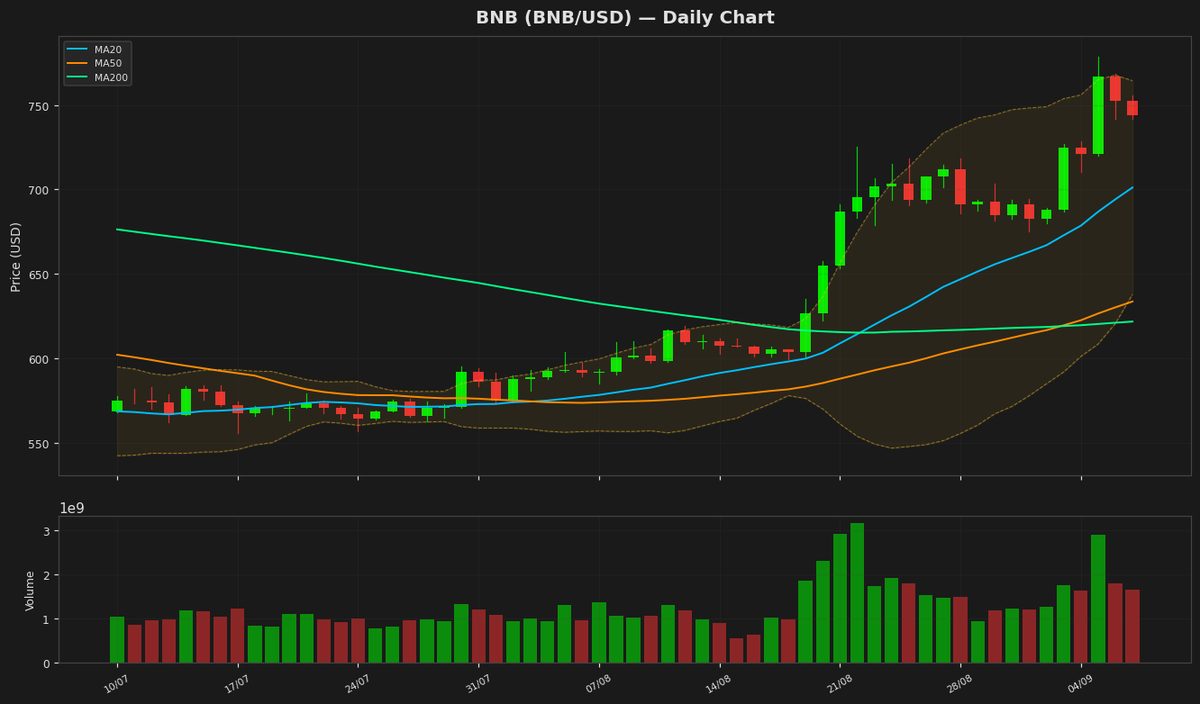
BNB cae a $744 mientras el RSI se acerca a la zona de sobrecompra
Crypto
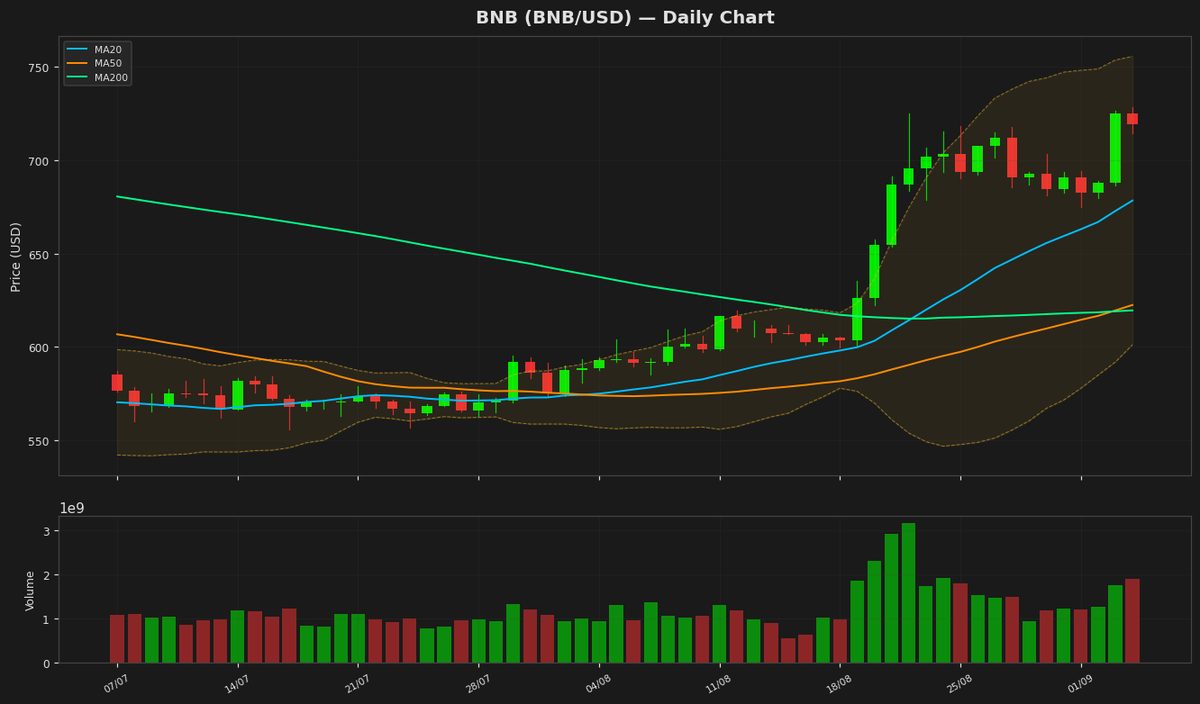
BNB cae a $719.54 mientras el RSI sugiere un posible rebote.
Crypto
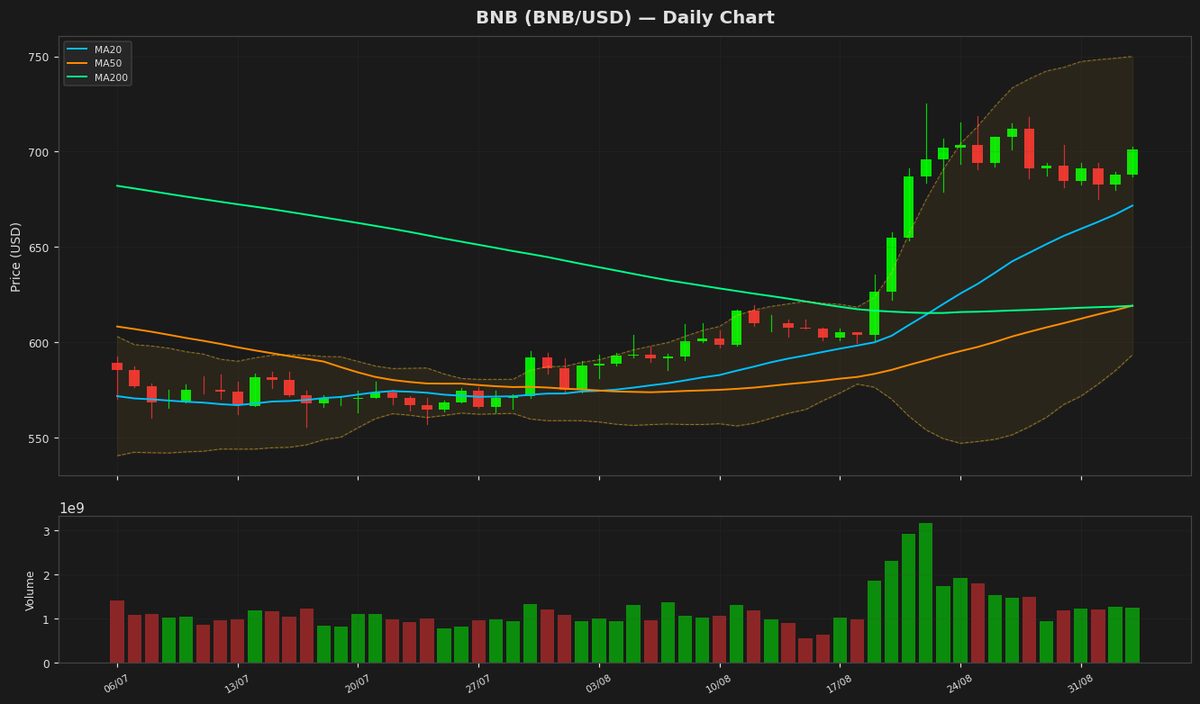
BNB alcanza los $700 mientras el RSI se acerca a la zona de sobrecompra
Crypto
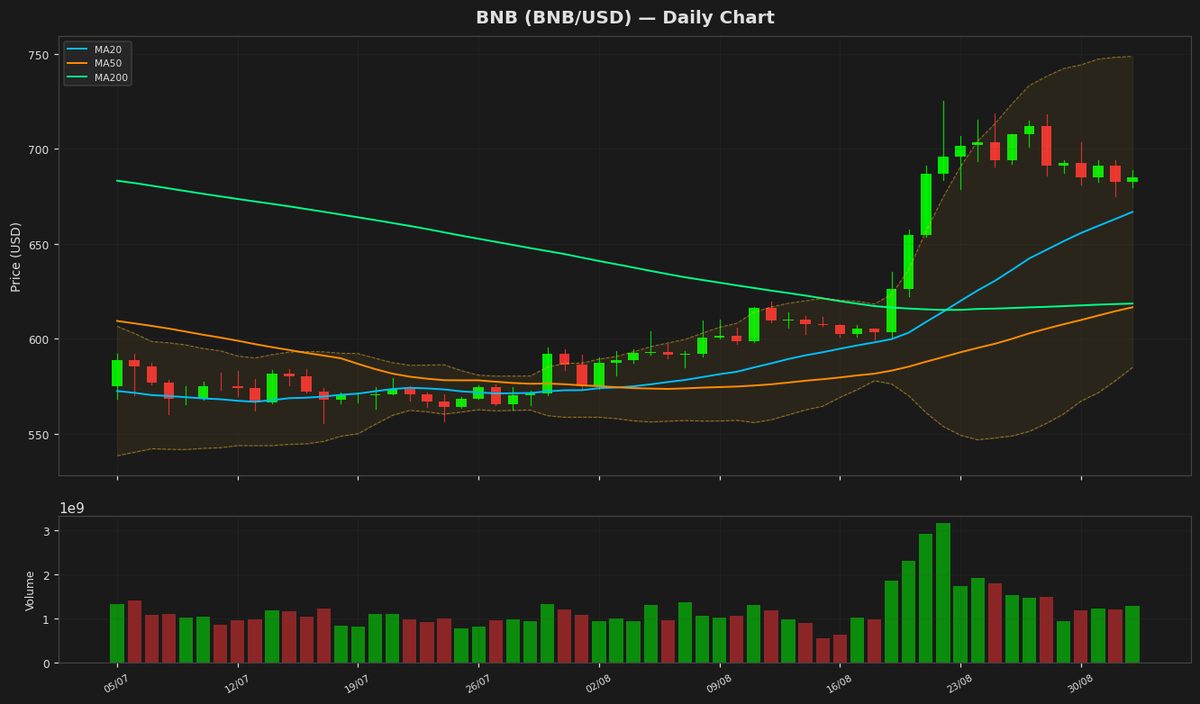
BNB apunta a $700 mientras el RSI se acerca a niveles de sobrecompra en $684.94 (+0.32%)
Crypto
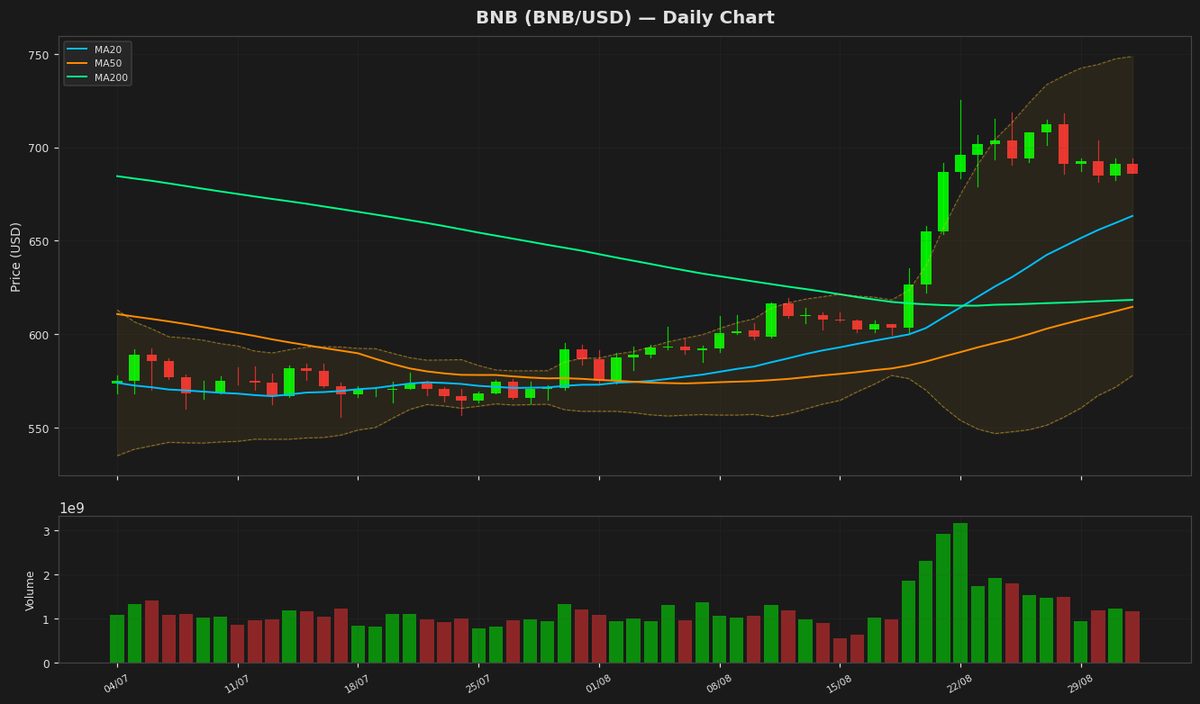
BNB se acerca a niveles de sobrecompra en $685 mientras el RSI alcanza 74.3
Crypto
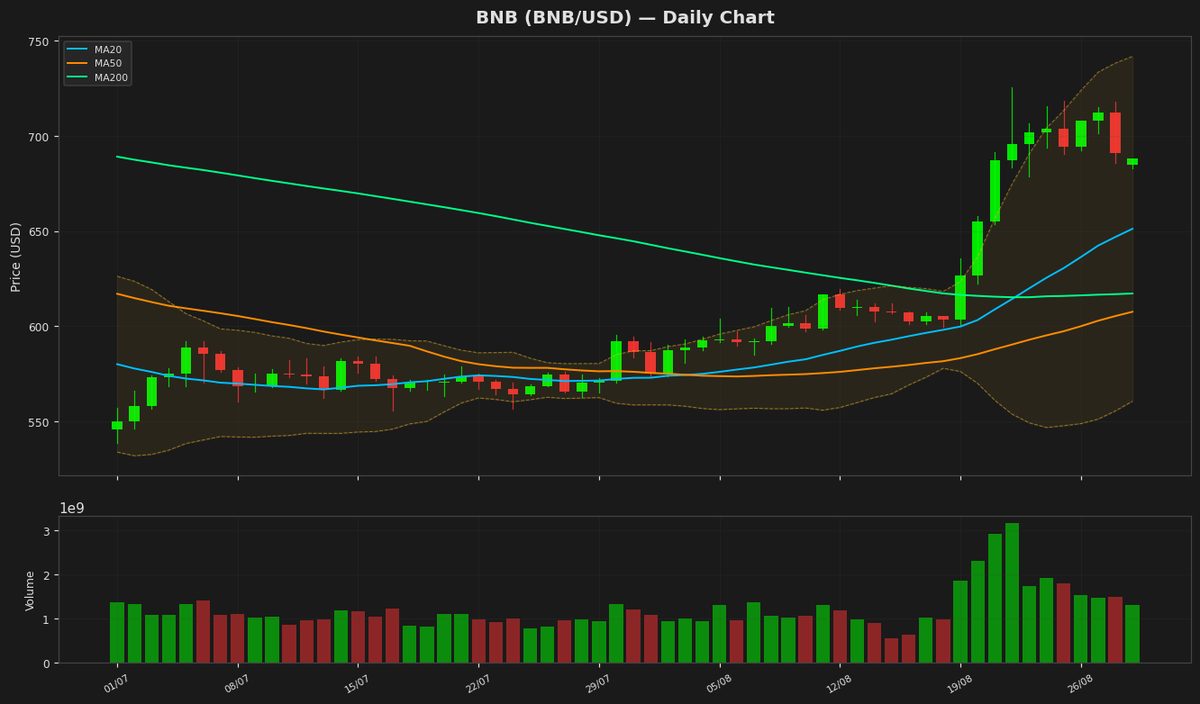
El BNB cae a $688.16 mientras que el RSI alcanza zona de sobrecompra en 75.2
Crypto
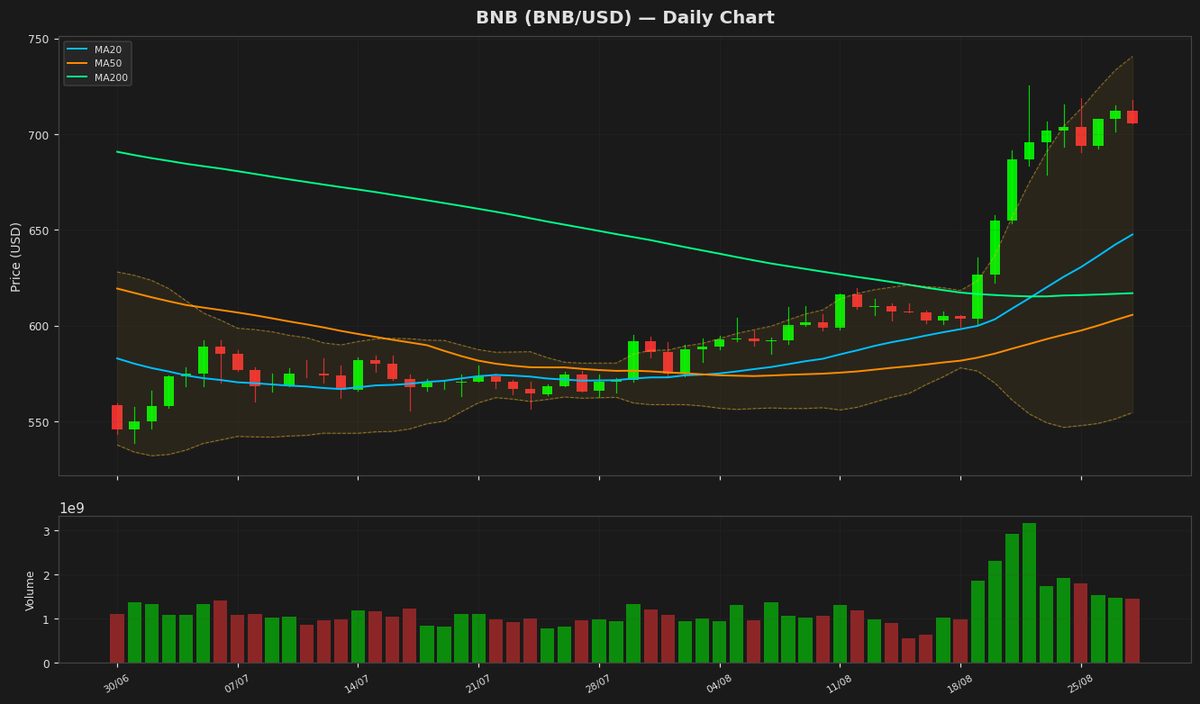
BNB cae por debajo de $706 mientras el RSI alcanza un nivel de sobrecompra de 84.1.
Crypto
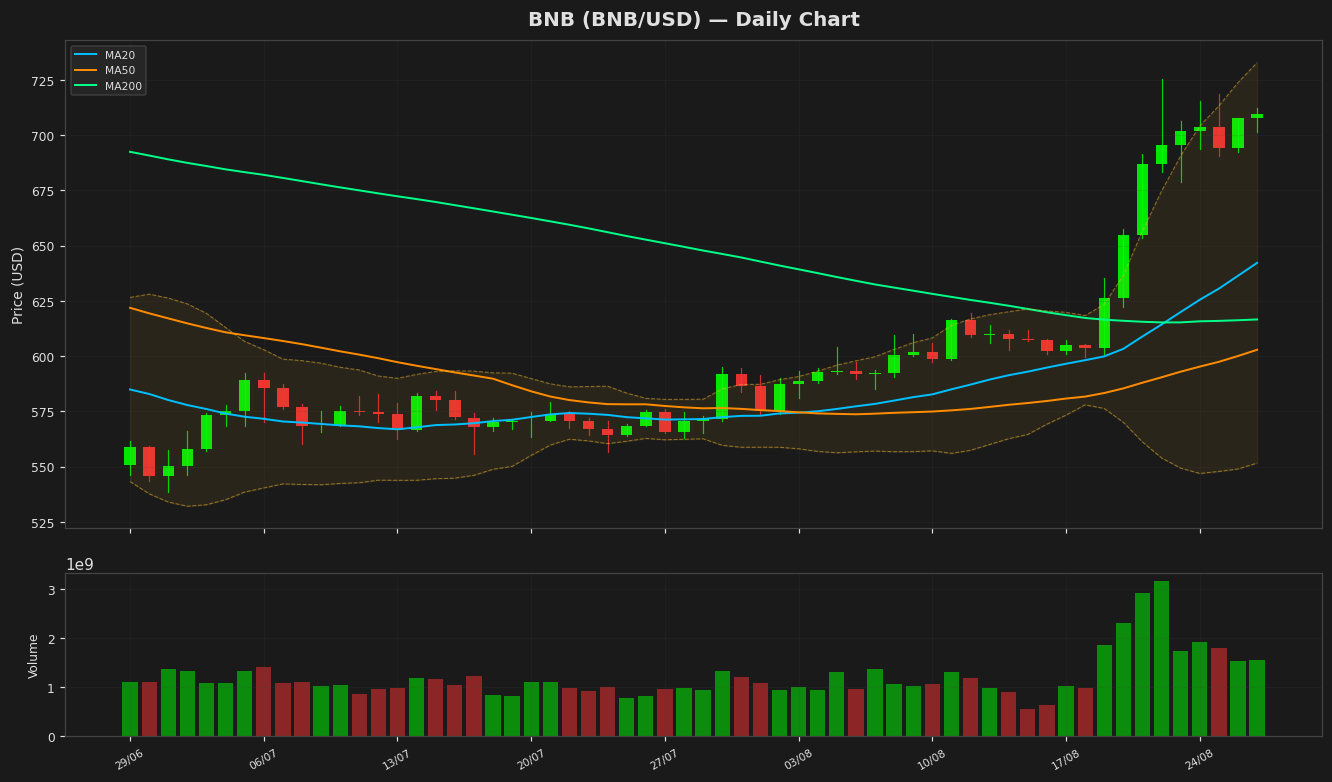
BNB alcanza los $709.42 mientras el RSI se acerca a niveles de sobrecompra en 86.3
Crypto
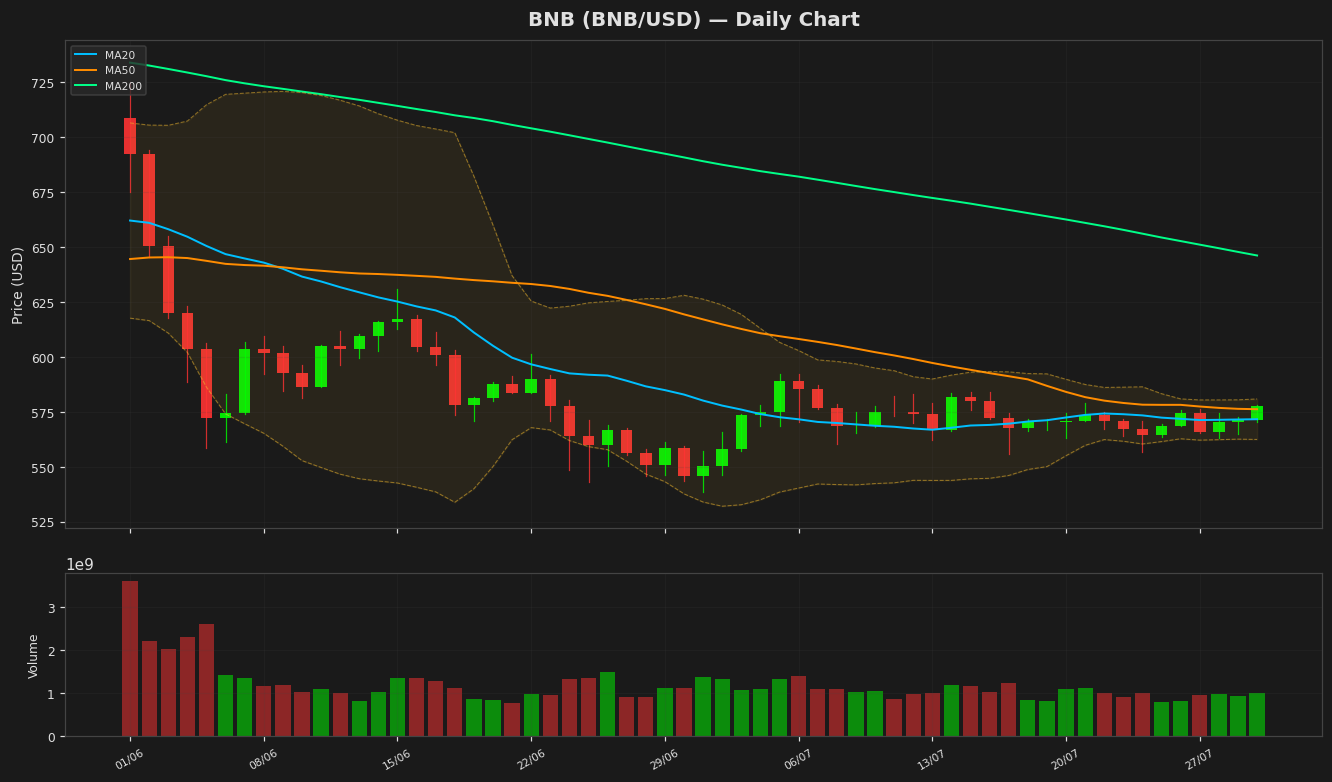
BNB apunta a $600 mientras el RSI se acerca a la zona alcista, subiendo un 1.07% hoy.
Crypto
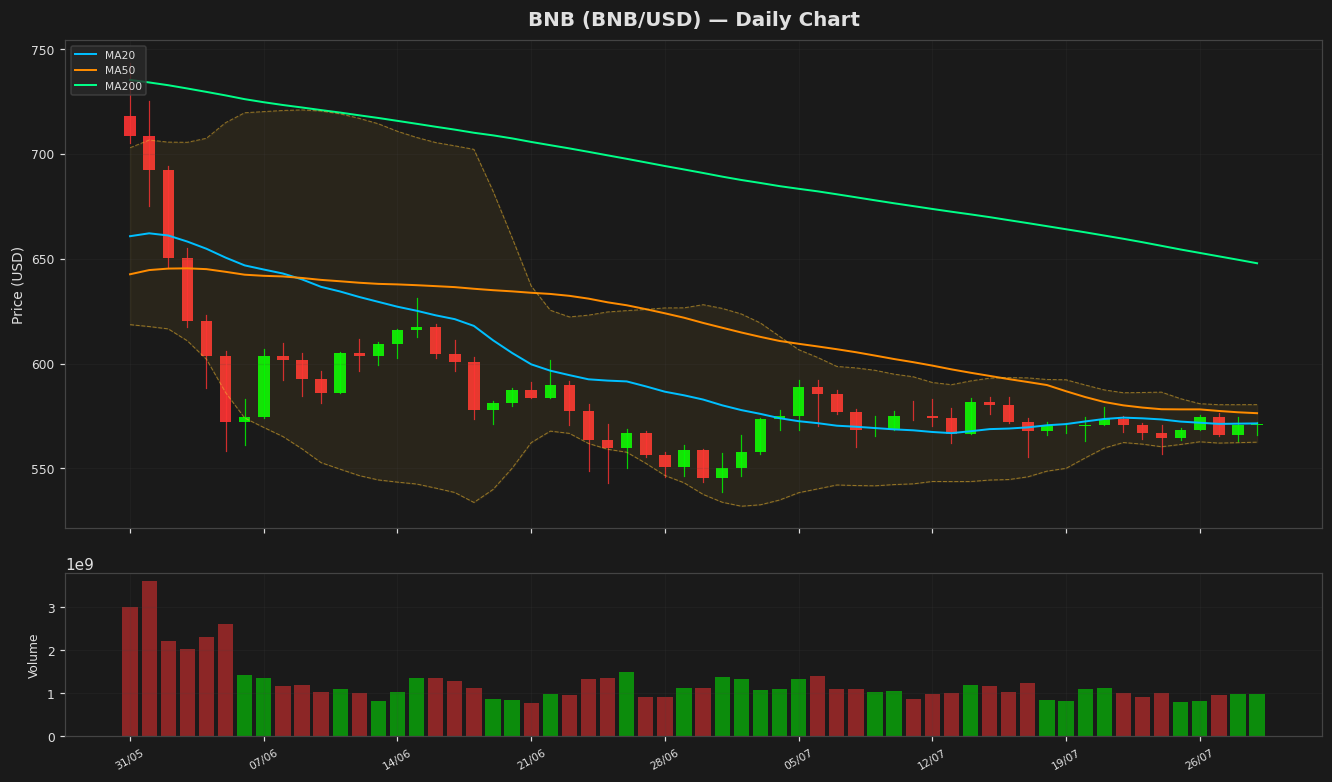
BNB se mantiene estable en $571 mientras el RSI se acerca a territorio de sobreventa
Crypto
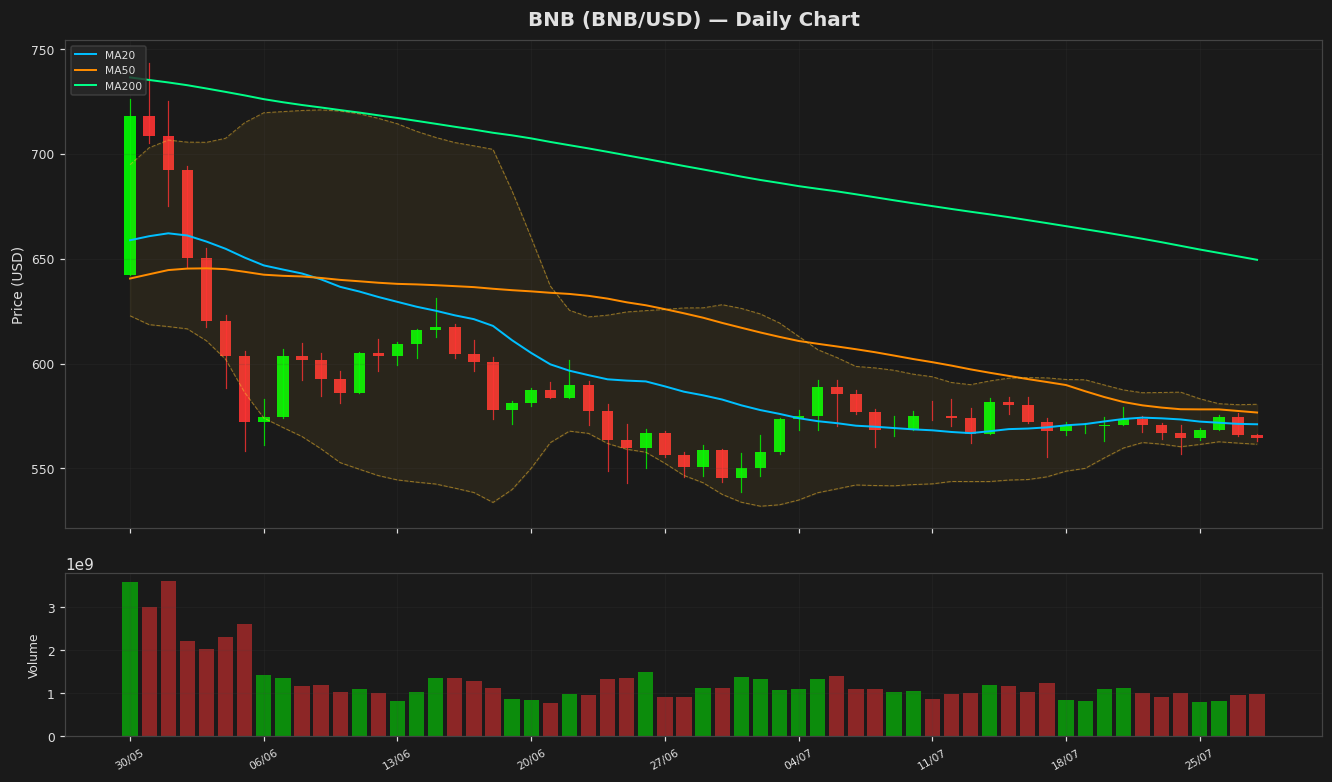
BNB cae a $564.70 mientras que el RSI alcanza niveles de sobreventa en 32.6
Crypto
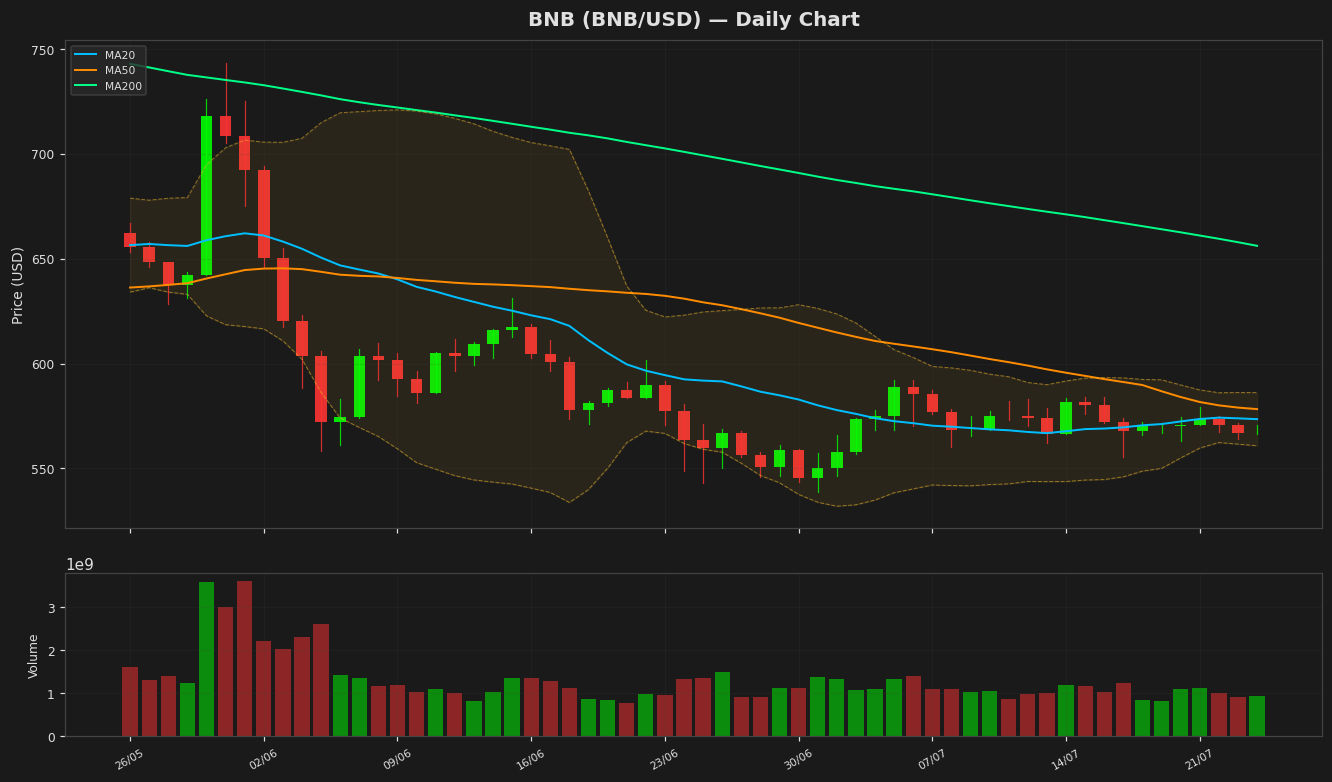
BNB se mantiene estable en $567 mientras el RSI se acerca a la zona de sobreventa.
Crypto
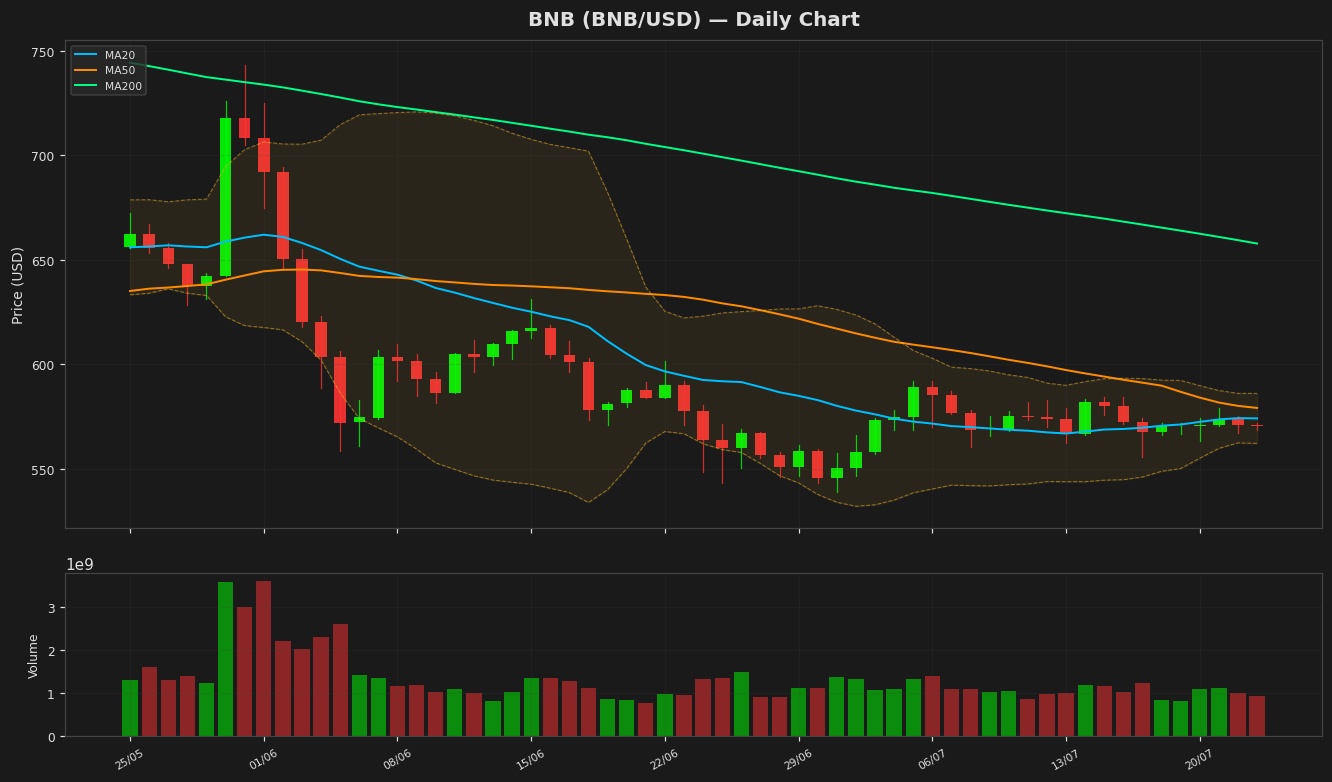
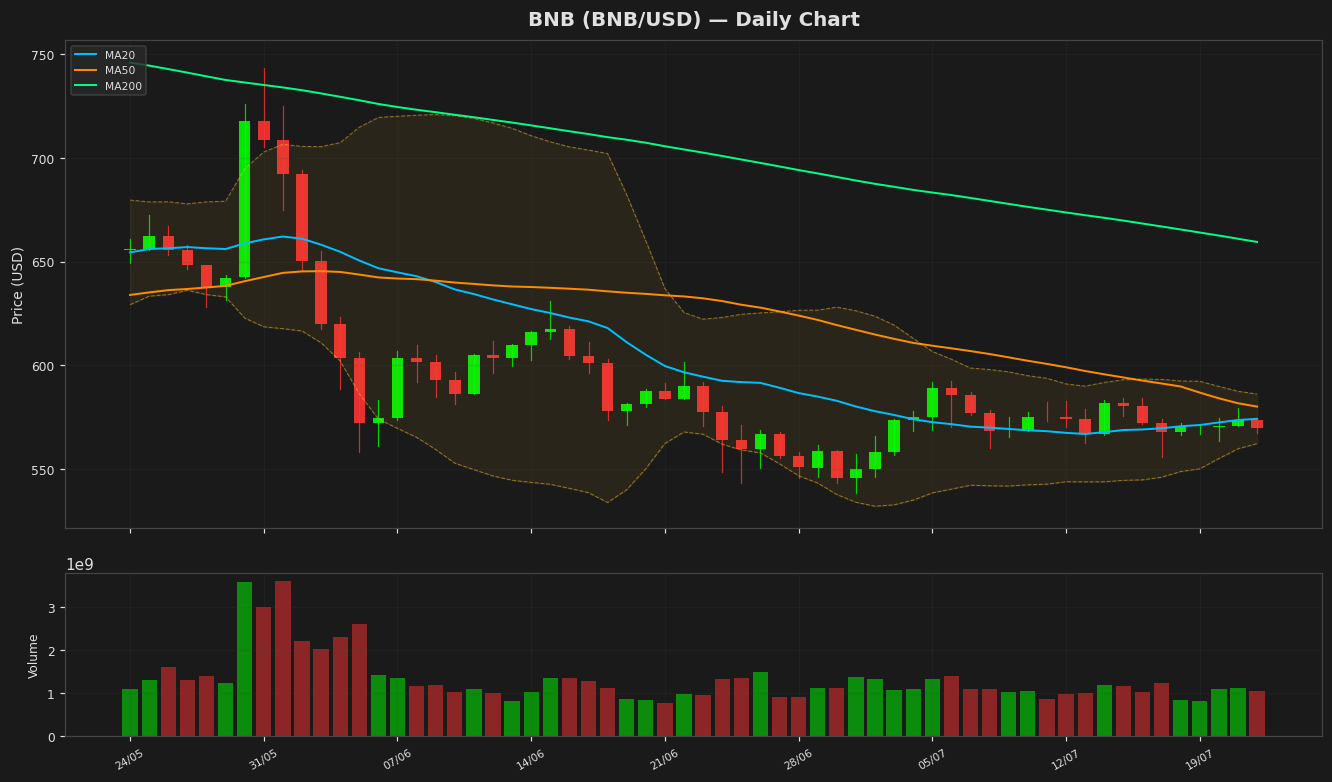
BNB is currently trading at $570, showing stability as its Relative Strength Index (RSI) approaches the midpoint. The RSI, a key momentum indicator, suggests that BNB is neither overbought nor oversold, indicating a balanced market sentiment. This stability could attract traders looking for steady assets amidst market volatility. Investors are advised to monitor the RSI for potential shifts that might signal upcoming price movements. Stay updated with the latest trends to make informed trading decisions. BNB Crypto Trading MarketAnalysis Stablecoin
Crypto
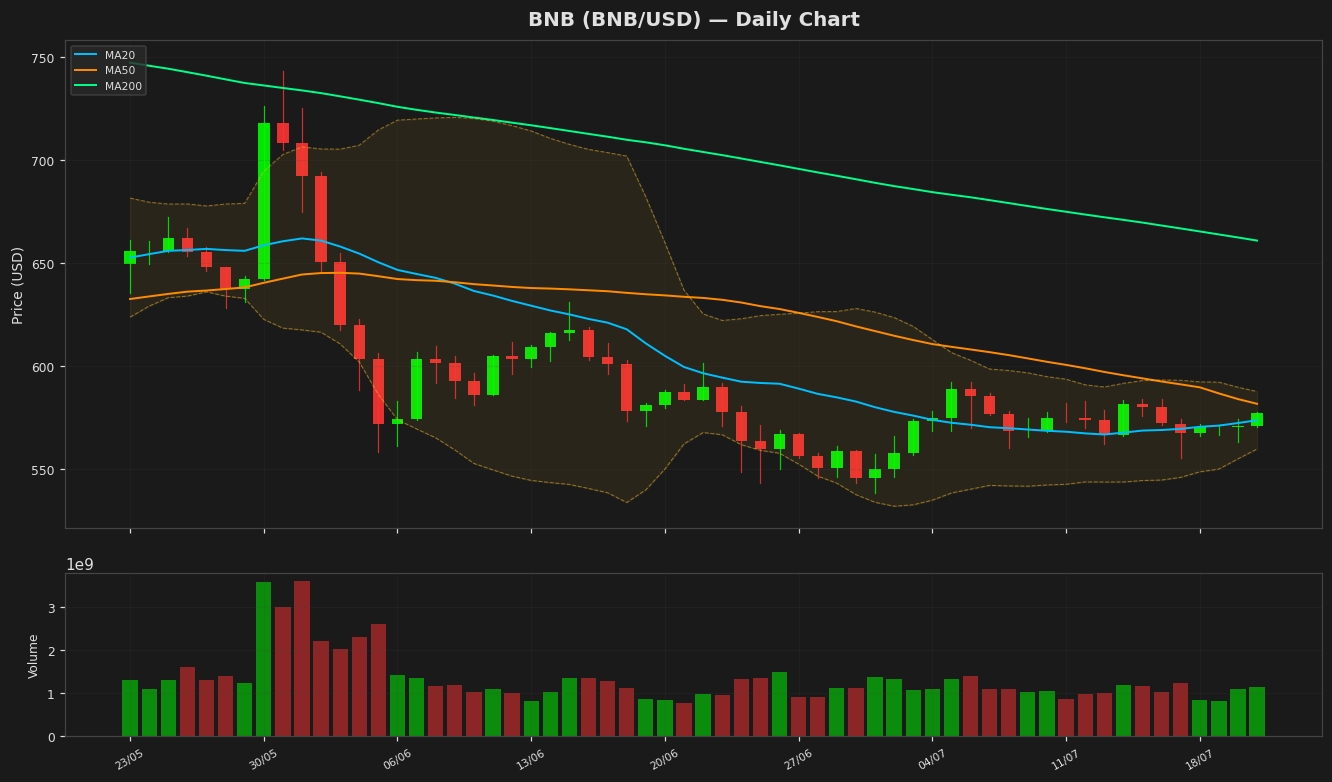
BNB se mantiene en $569.50 mientras el RSI se acerca al punto medio, con la mira en un rebote.
Crypto
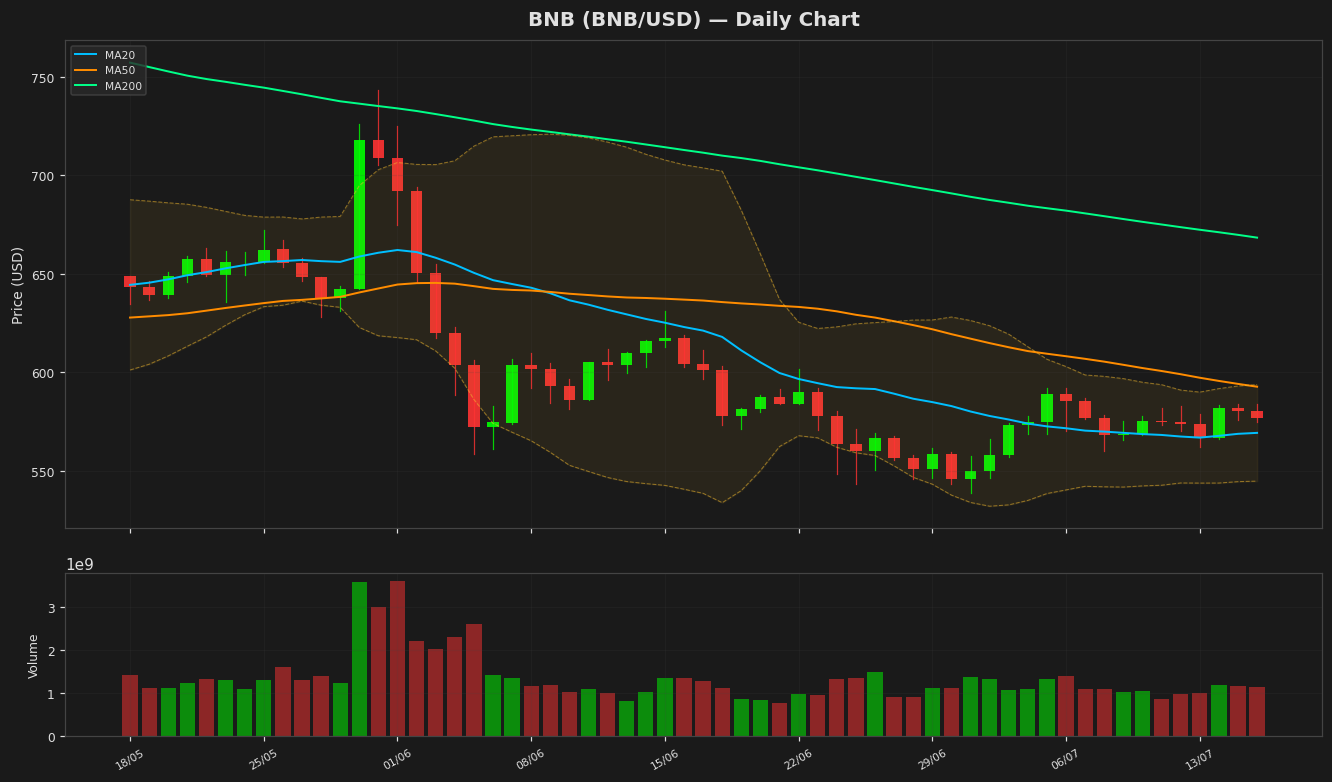
The BNB price is currently trading at $577.32, showing a 1.5% increase in the last 24 hours. The Relative Strength Index (RSI) is at 60.2, indicating a neutral market sentiment with potential for upward movement if the RSI breaks above 70. The Moving Average Convergence Divergence (MACD) shows a bullish crossover, suggesting positive momentum.
Key Levels to Watch:
- Support: $550 (psychological level and recent low)
- Resistance: $600 (next major psychological barrier)
Potential Scenarios:
1. Bullish Breakout: If BNB breaks above $600, the next target could be $620 (previous high).
2. Bearish Rejection: Failure to hold above $550 could lead to a drop toward $520.
Market Sentiment:
- Neutral to Bullish: The RSI and MACD suggest growing buying pressure, but traders should watch for confirmation above $600.
Conclusion:
BNB is testing key resistance at $600, and a breakout could lead to further gains. Keep an eye on the RSI and MACD for confirmation of the trend.
Short-term Outlook: Bullish if $600 is breached.
Would you like a deeper analysis on trading volume or other indicators?
Crypto
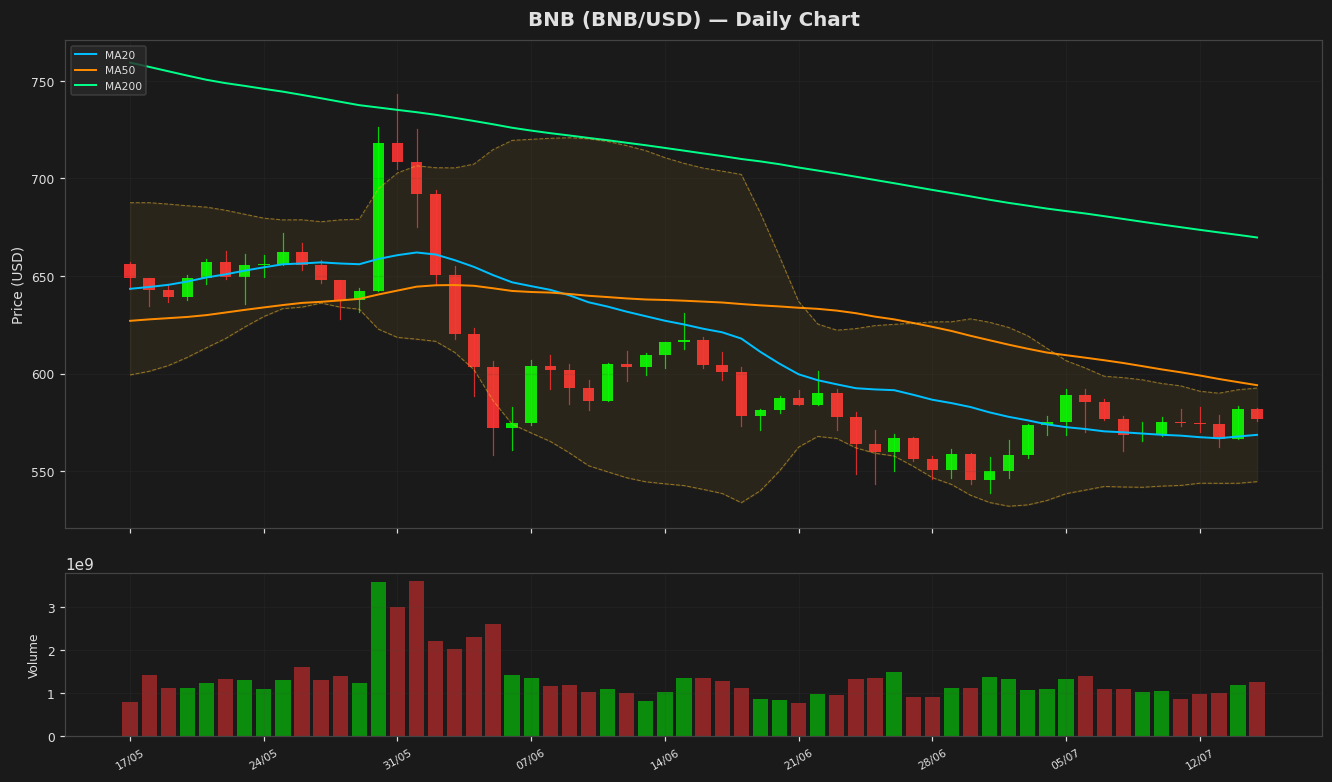
BNB se mantiene en $576 mientras el RSI se acerca a la zona de sobrecompra.
Crypto
BNB cae a $576.81 mientras el RSI sugiere presión de sobrecompra.
Crypto
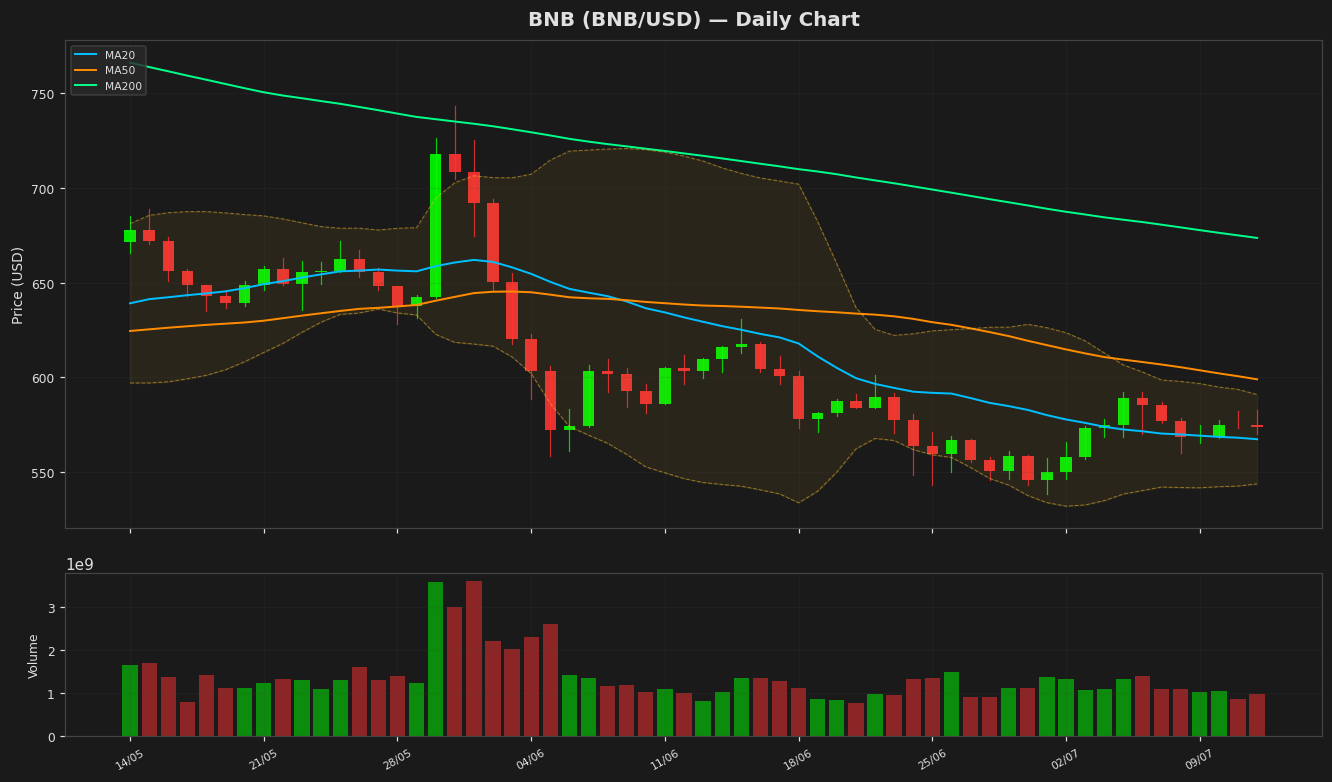
BNB se mantiene en $574 mientras el RSI se acerca a la zona de sobrecompra
Crypto
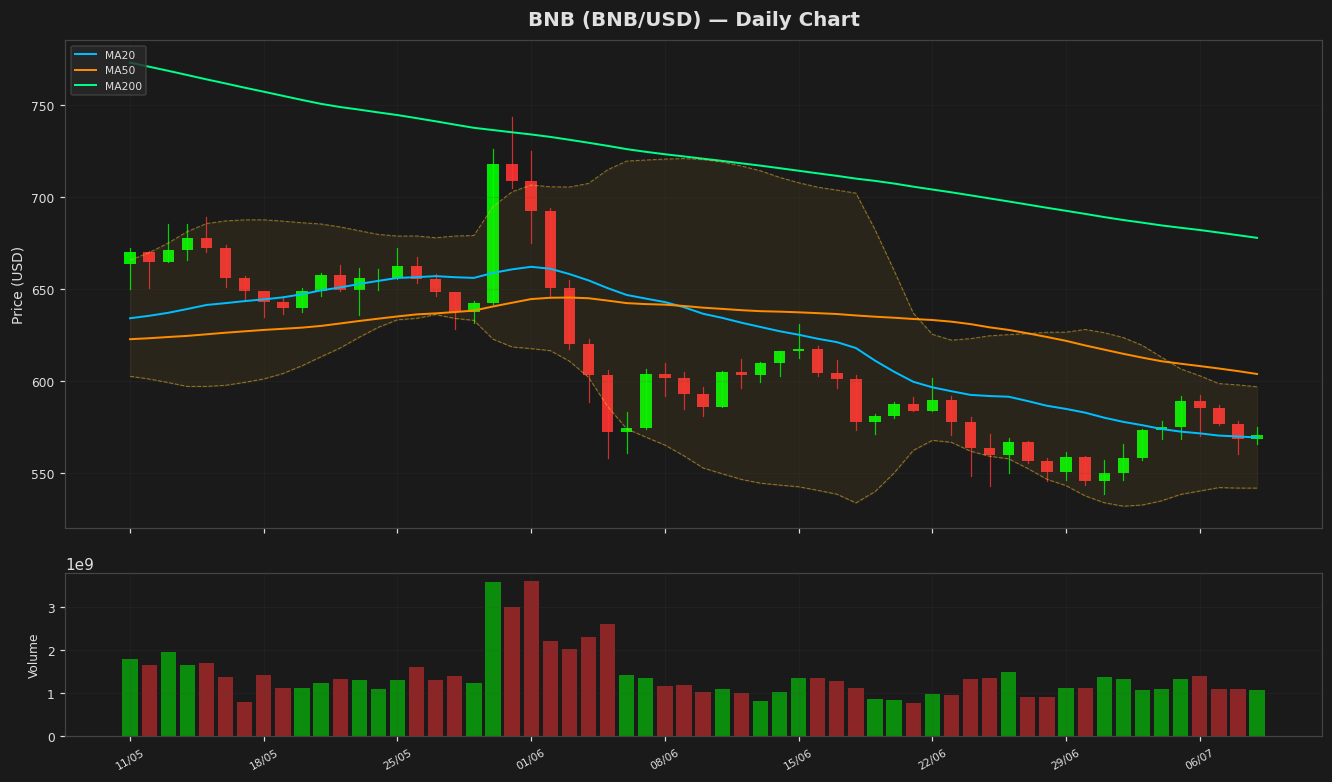
BNB se mantiene estable en $570 mientras el RSI se acerca al punto medio.
Crypto
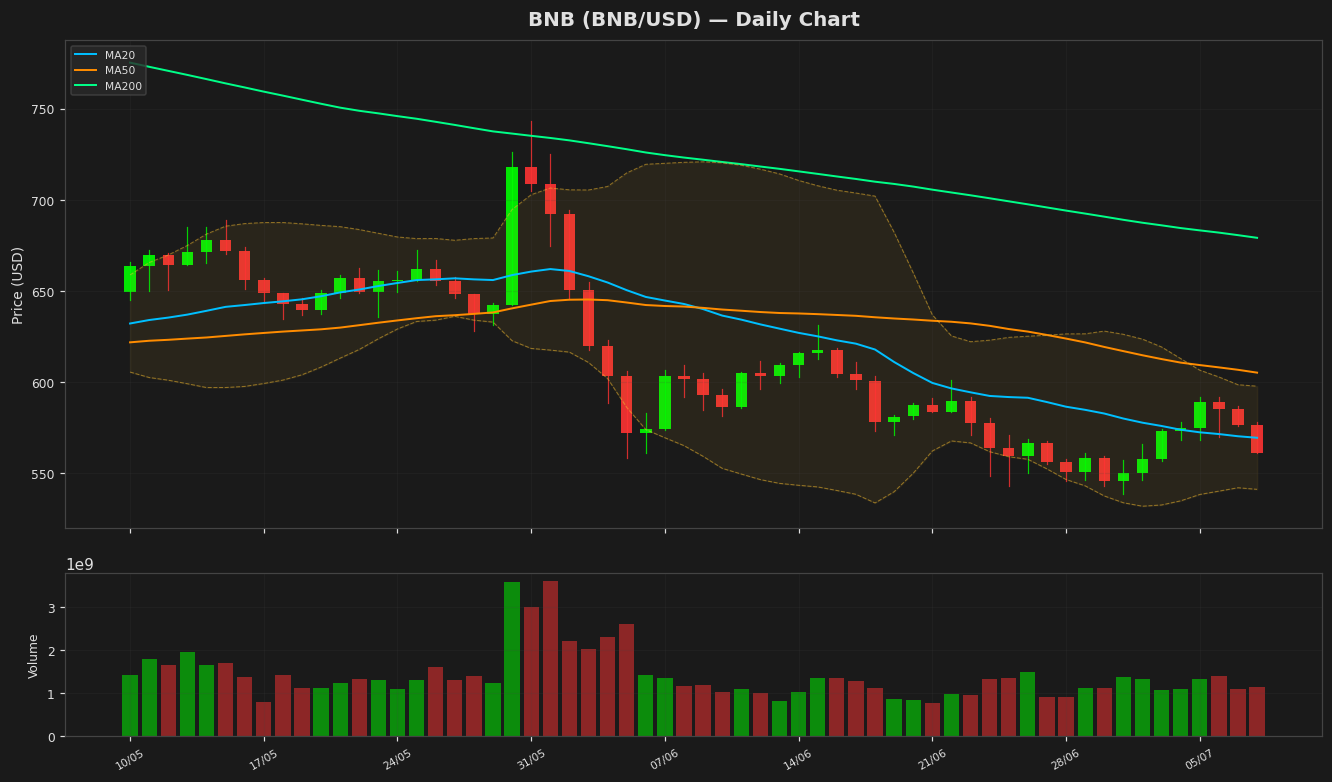
BNB cae a $561 mientras el RSI se acerca a 50: ¿Es momento de comprar?
Crypto
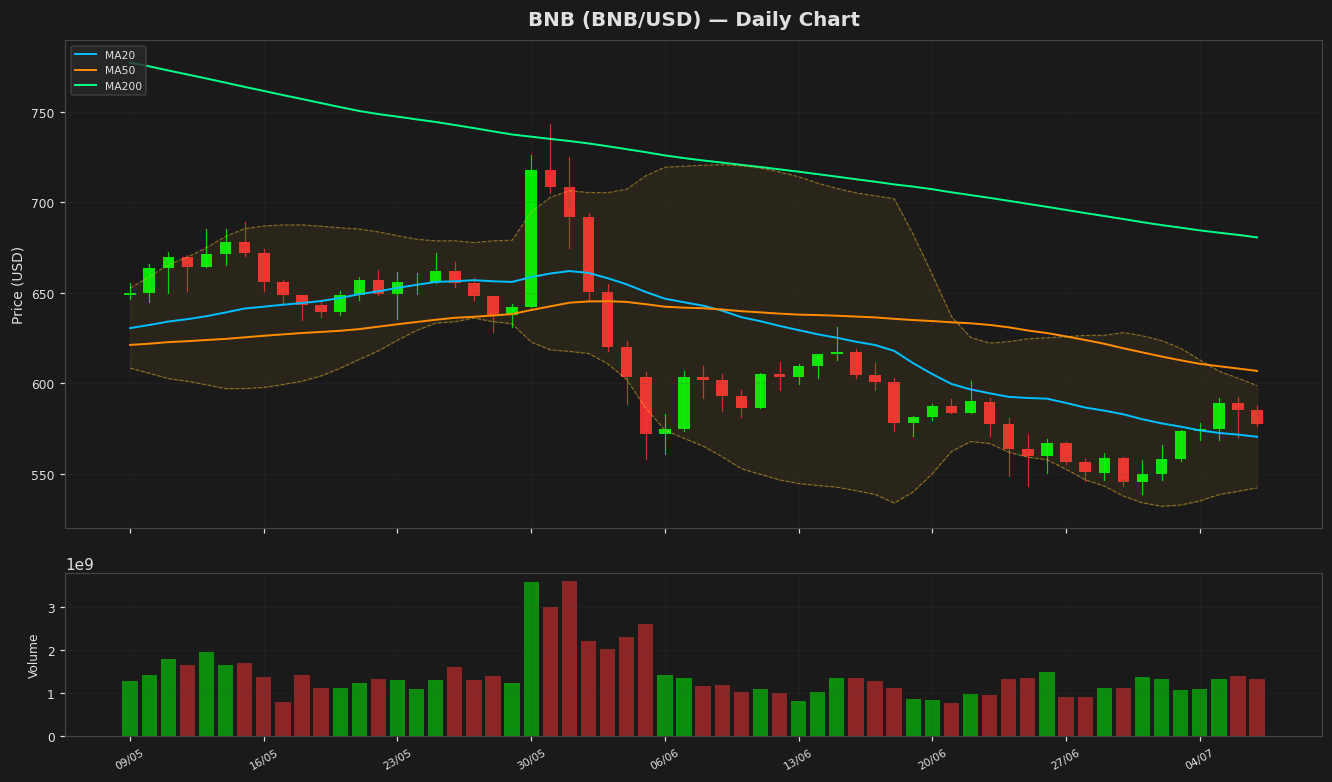
BNB is currently testing the $577.50 resistance level, with the RSI showing signs of a potential reversal. The Relative Strength Index (RSI) is a key indicator to watch, as it suggests that BNB might be gearing up for a bullish breakout if the resistance is breached.
Key Levels to Watch:
- Resistance: $577.50 (critical breakout level)
- Support: $550 (short-term support)
RSI Analysis:
The RSI is hovering around the mid-range, indicating neither overbought nor oversold conditions. A move above 60 could signal increasing bullish momentum, while a drop below 40 might suggest further downside.
Potential Scenarios:
1. Bullish Breakout: If BNB clears $577.50 with strong volume, the next target could be $600 and beyond.
2. Rejection at Resistance: Failure to break $577.50 could lead to a retest of $550 or lower support levels.
Traders should monitor the RSI closely for confirmation of a trend reversal and watch for volume spikes to validate any breakout attempts.
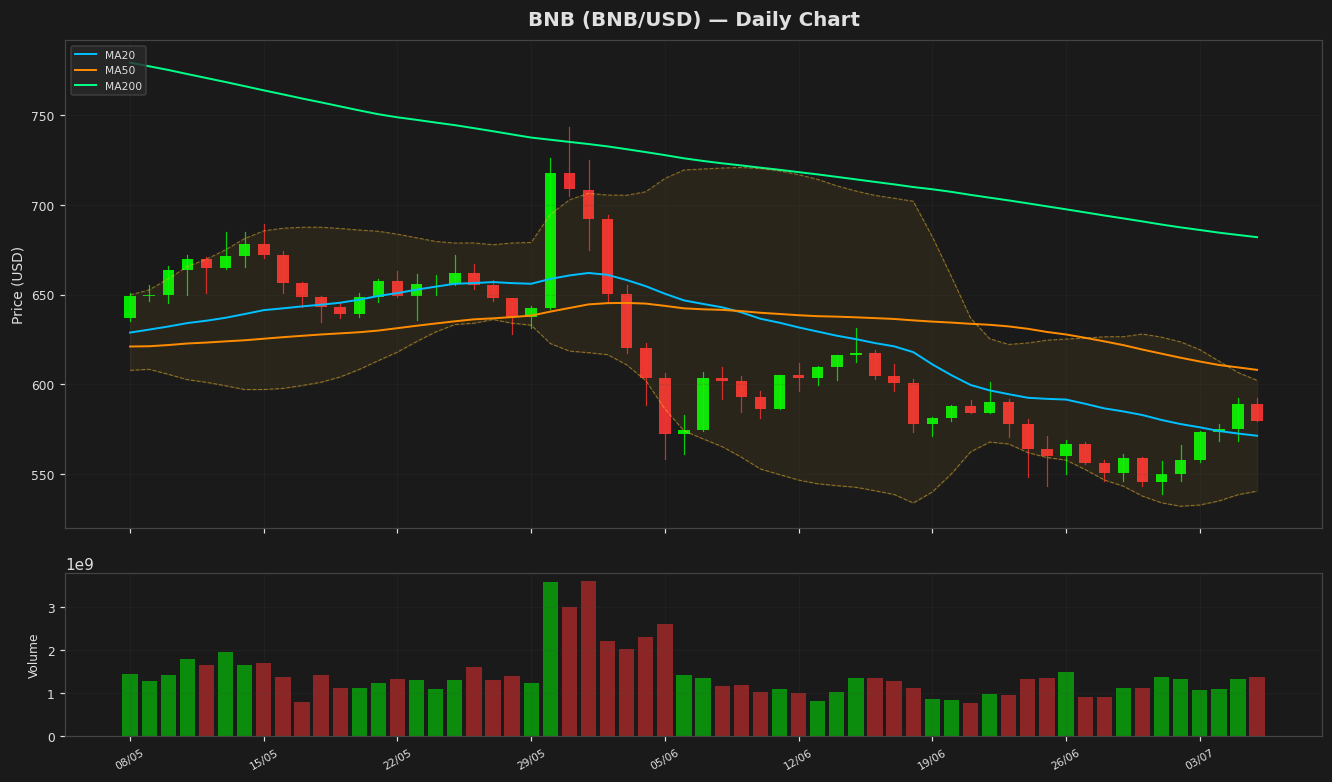
Crypto
BNB cae a $579.62, el RSI se acerca a niveles de sobreventa en 45.9
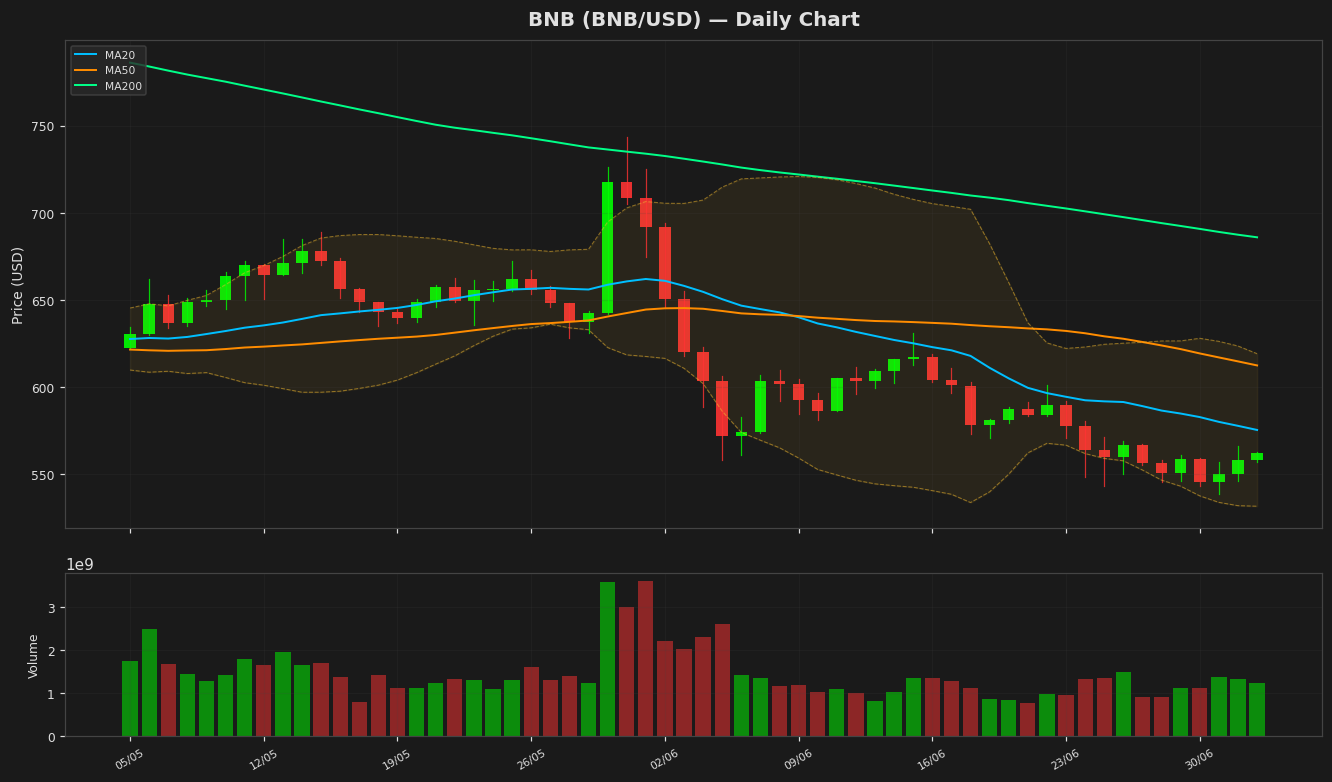
Crypto
BNB busca recuperación en $562 mientras el RSI sugiere un rebote por sobreventa
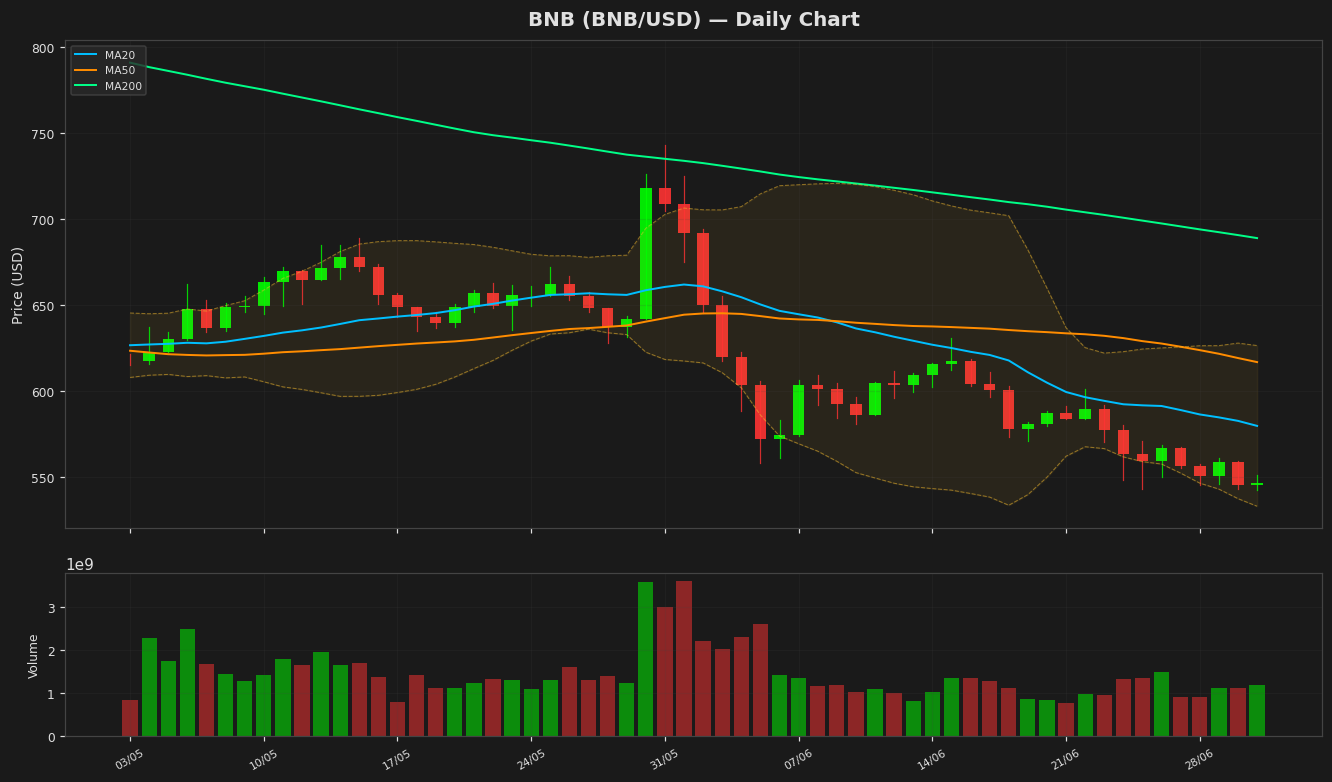
Crypto
The current price of BNB (Binance Coin) is $546.64, with a Relative Strength Index (RSI) of 29.35, indicating that BNB is in oversold territory.
Key Takeaways:
1. Oversold RSI (29.35) – Typically, an RSI below 30 suggests an asset is oversold, which may precede a potential rebound.
2. Short-Term Opportunity – Traders might see this as a buying opportunity if momentum shifts upward.
3. Caution Advised – While oversold conditions can signal a reversal, confirmation (e.g., rising volume, bullish candlestick patterns) is needed before assuming a sustained recovery.
What to Watch:
- RSI Rebound: If RSI climbs back above 30, it could indicate strengthening momentum.
- Support Levels: Monitor key support near $540–$530; a hold here may reinforce bullish sentiment.
- Market Sentiment: Broader crypto trends (e.g., Bitcoin’s movement) could influence BNB’s direction.
Conclusion:
BNB’s oversold RSI hints at a possible short-term bounce, but traders should wait for confirmation before entering positions.
Would you like a deeper technical analysis or historical context for BNB’s RSI trends?
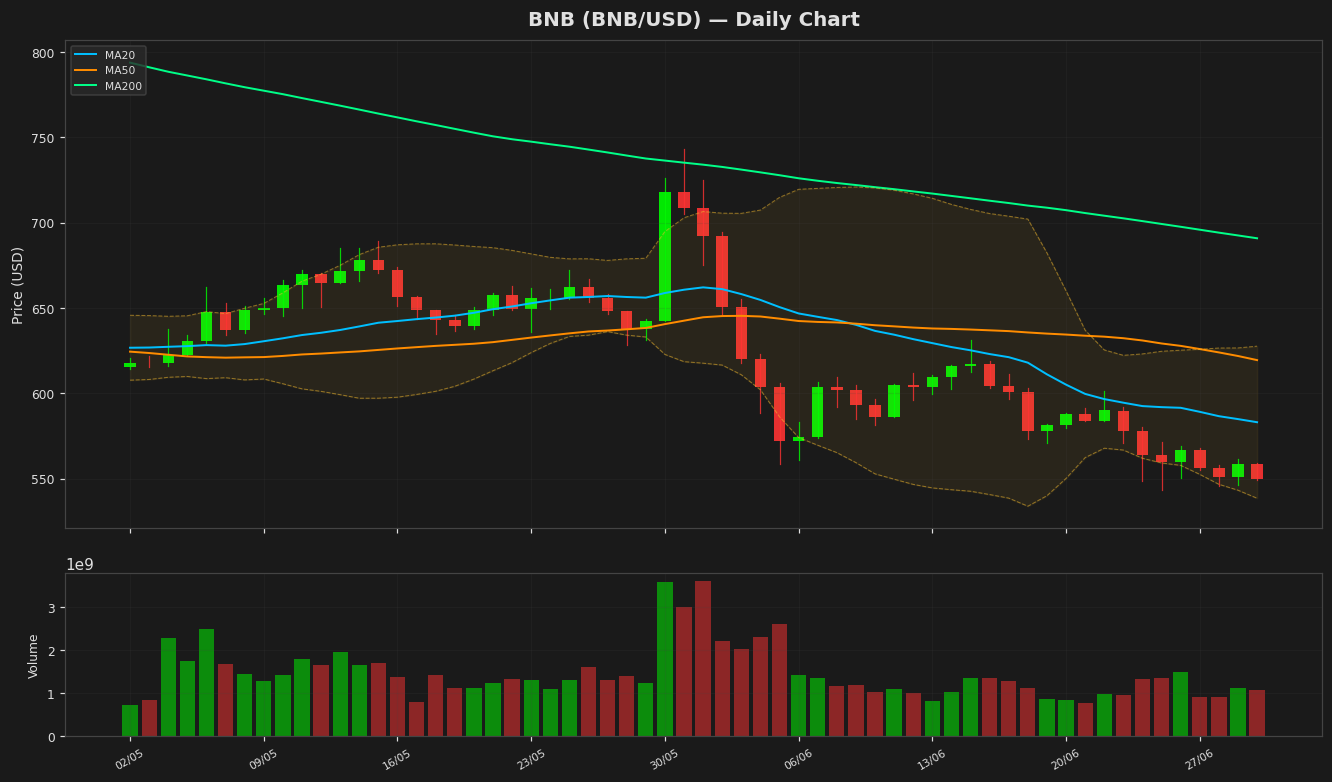
Crypto
BNB's price has dropped to $549.59, marking a 5.3% decline over the past 24 hours. The Relative Strength Index (RSI) has fallen to 26.5, indicating that BNB is now in oversold territory.
Key Observations:
- RSI (14): 26.5 (below 30 suggests oversold conditions)
- 24h Change: -5.3%
- Current Price: $549.59
Historically, oversold RSI levels have preceded short-term rebounds, but market sentiment remains cautious amid broader crypto weakness.
Would you like a deeper analysis of support levels or potential reversal signals?
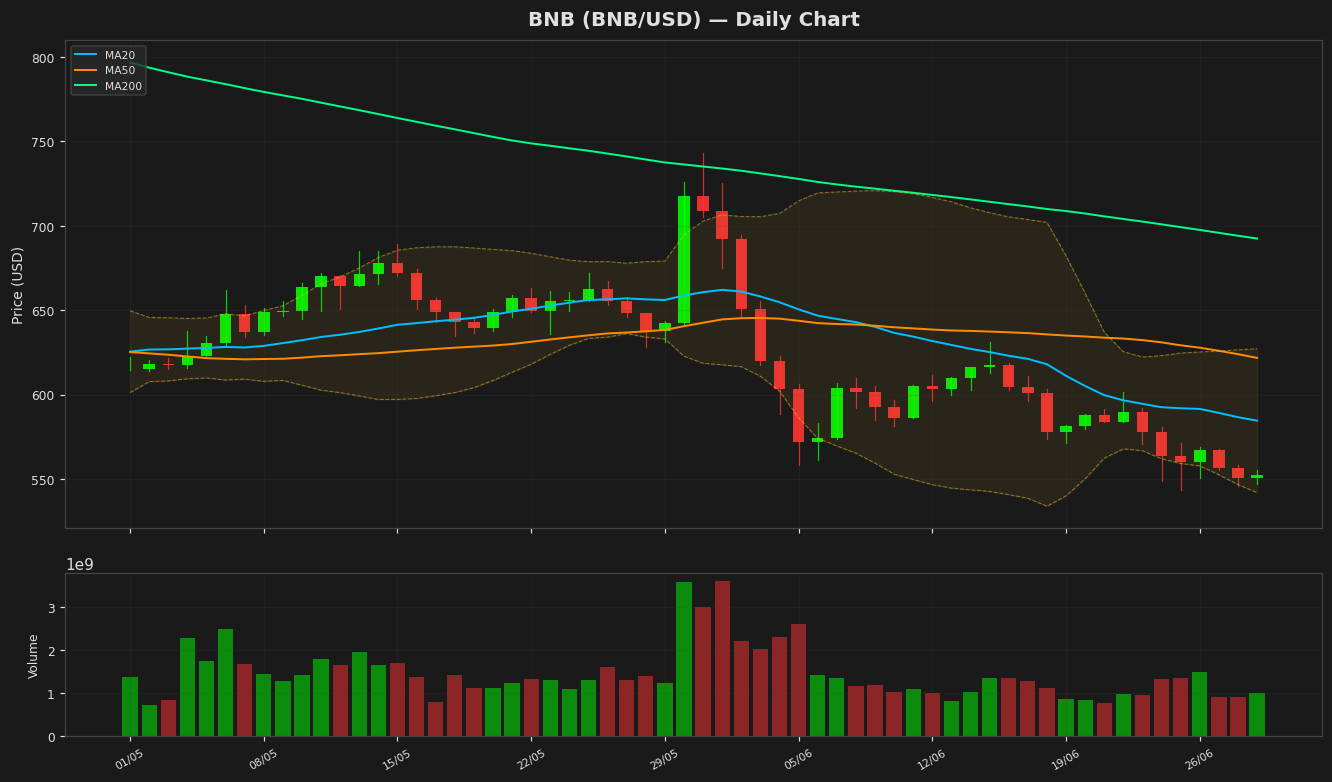
Crypto
BNB a $552: RSI en sobreventa sugiere rebote tras ganancia del 0.26%
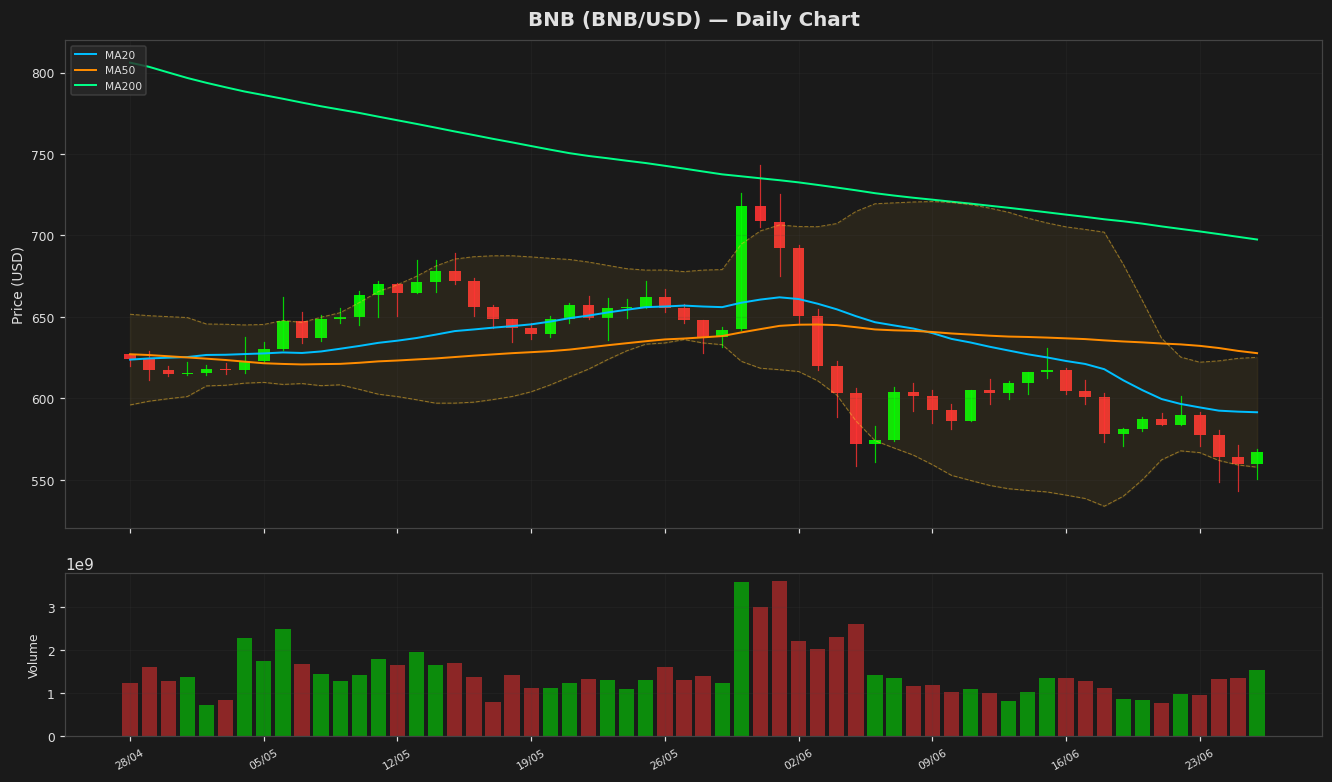
Crypto
BNB en $567: RSI en sobreventa sugiere rebote con una ganancia diaria del 1.29%
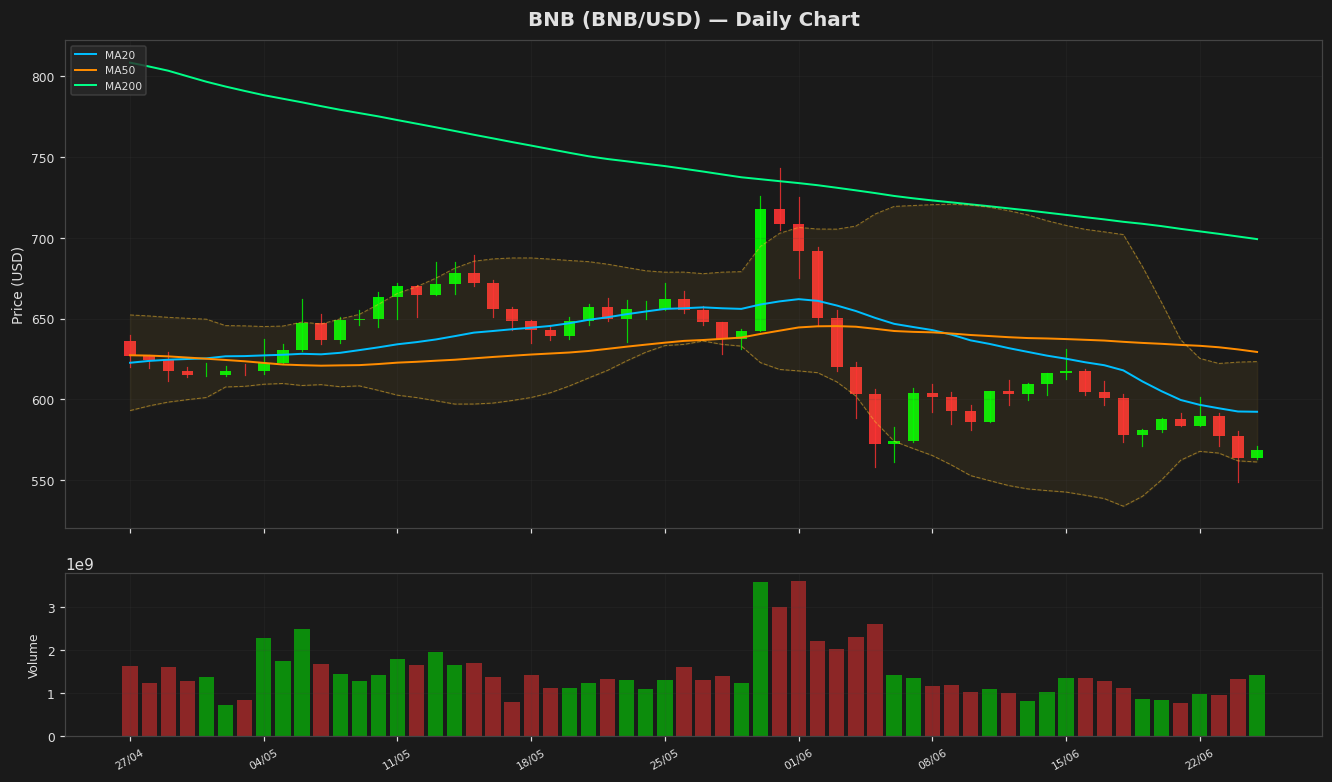
Crypto
BNB a $568: RSI en sobreventa señala posible rebote tras ganancia del 0.86%
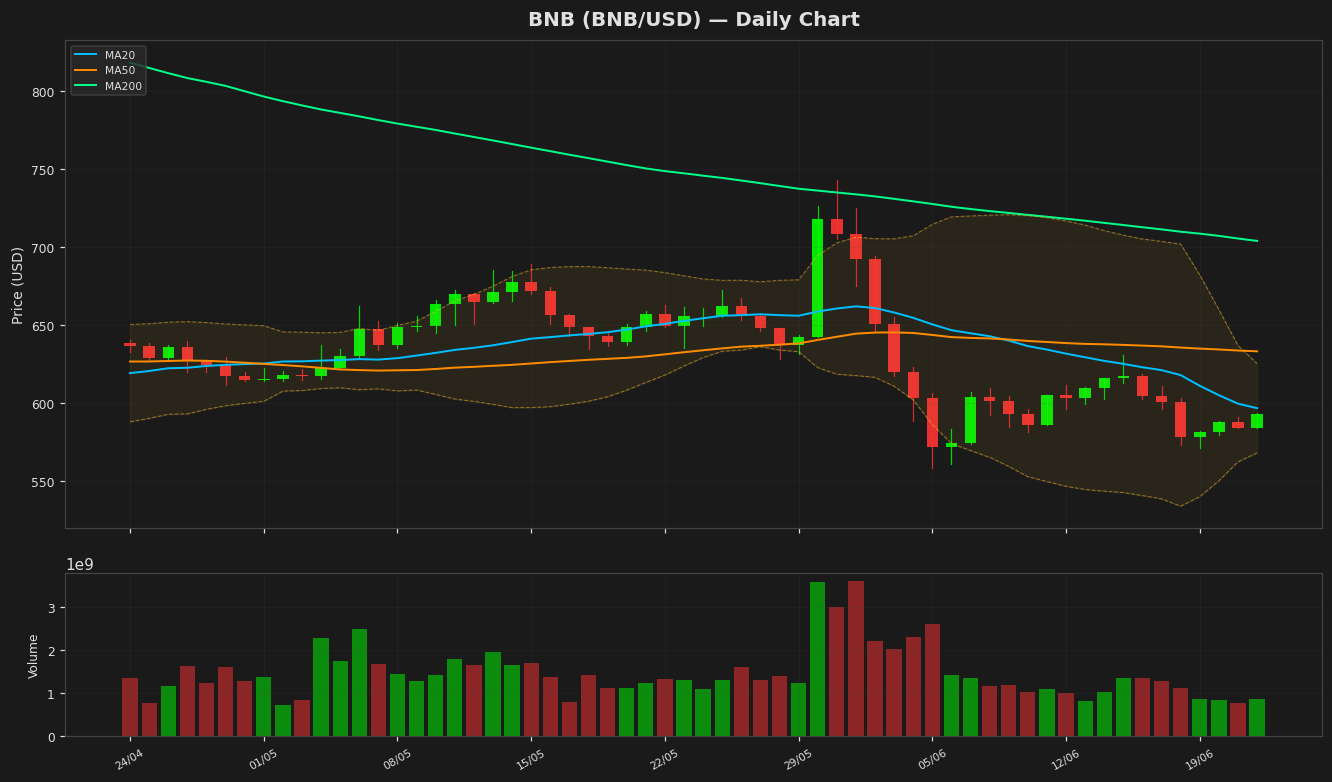
Crypto
BNB busca romper resistencia al alcanzar los $592.85, el RSI señala oportunidad
Crypto
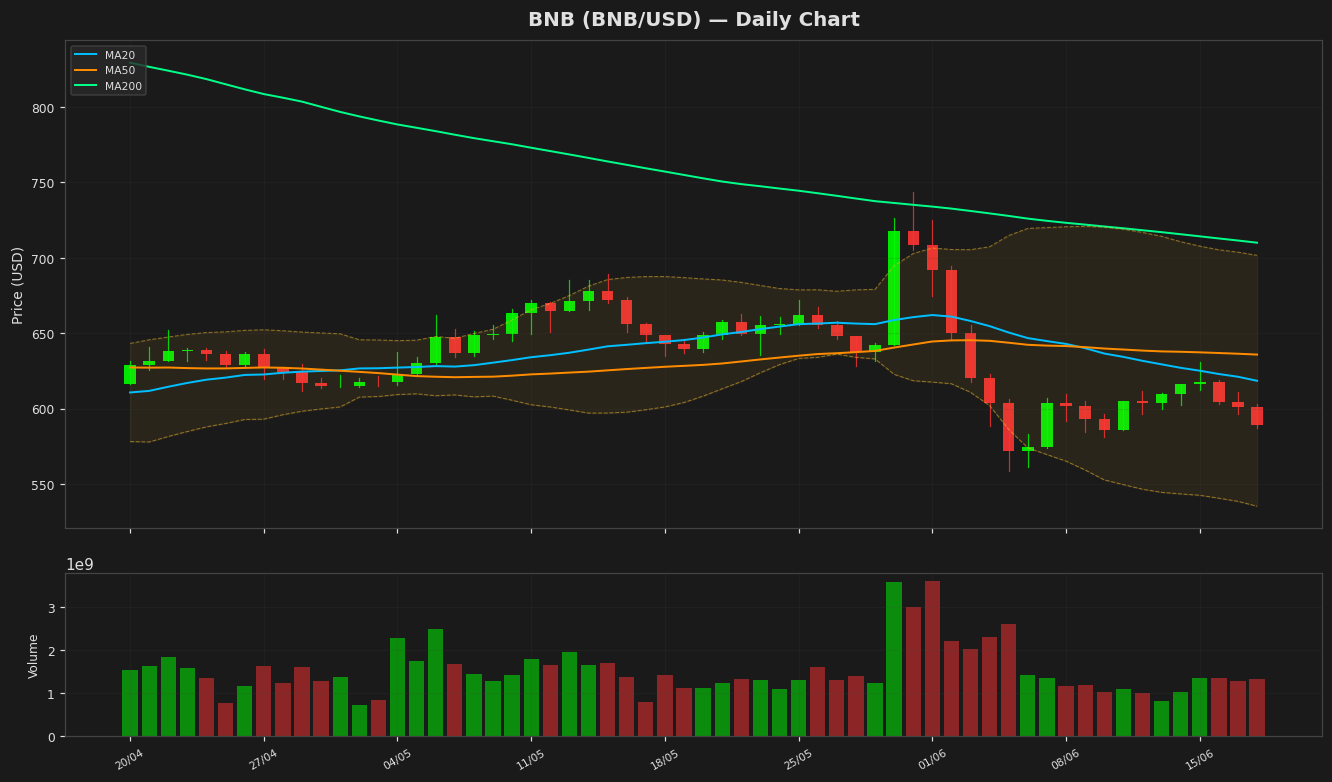
BNB cae por debajo de $590 mientras aumenta la presión bajista – RSI en 44.9